. 2009 Oct;21(10):3185-97.
doi: 10.1105/tpc.108.063883. Epub 2009 Oct 13.

Crosstalk between cold response and flowering in Arabidopsis is mediated through the flowering-time gene SOC1 and its upstream negative regulator FLC

Affiliations

Crosstalk between cold response and flowering in Arabidopsis is mediated through the flowering-time gene SOC1 and its upstream negative regulator FLC

Eunjoo Seo et al. Plant Cell. 2009 Oct.

Abstract

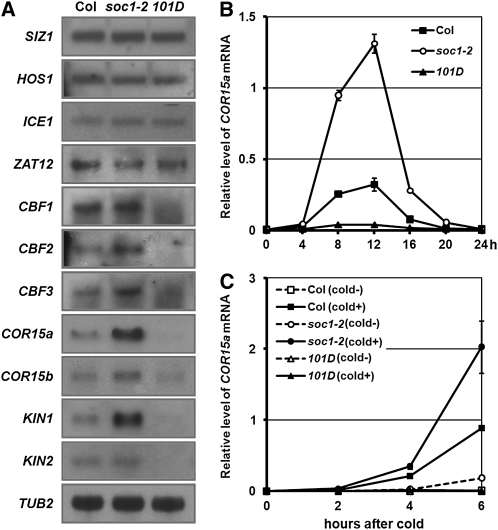
The appropriate timing of flowering is pivotal for reproductive success in plants; thus, it is not surprising that flowering is regulated by complex genetic networks that are fine-tuned by endogenous signals and environmental cues. The Arabidopsis thaliana flowering-time gene SUPPRESSOR OF OVEREXPRESSION OF CONSTANS1 (SOC1) encodes a MADS box transcription factor and is one of the key floral activators integrating multiple floral inductive pathways, namely, long-day, vernalization, autonomous, and gibberellin-dependent pathways. To elucidate the downstream targets of SOC1, microarray analyses were performed. The analysis revealed that the soc1-2 knockout mutant has increased, and an SOC1 overexpression line has decreased, expression of cold response genes such as CBFs (for CRT/DRE binding factors) and COR (for cold regulated) genes, suggesting that SOC1 negatively regulates the expression of the cold response genes. By contrast, overexpression of cold-inducible CBFs caused late flowering through increased expression of FLOWERING LOCUS C (FLC), an upstream negative regulator of SOC1. Our results demonstrate the presence of a feedback loop between cold response and flowering-time regulation; this loop delays flowering through the increase of FLC when a cold spell is transient as in fall or early spring but suppresses the cold response when floral induction occurs through the repression of cold-inducible genes by SOC1.


Figures

Figure 1.
Figure 1.
SOC1 Negatively Regulates Cold-Inducible Genes. (A) Expressions of cold-responsive genes in wild-type (Col), soc1-2, and soc1-101D (101D) was detected by RNA gel blot analysis. TUB2 was used as a quantitative control. Plants grown at 22°C for 10 d under 16-h-light/8-h-dark long-day conditions were harvested at 8 h after dawn for RNA isolation. (B) Daily rhythm of COR15a expression in wild-type, soc1-2, and soc1-101D grown under long days was detected by quantitative RT-PCR. The values and error bars represent mean value and sd, respectively, from three technical replicates. The 10-d-old seedlings grown 16-h-light/8-h-dark conditions were harvested every 4 h for RNA isolation. The zero time corresponds to right after dawn. (C) Cold response of COR15a in wild-type, soc1-2, and soc1-101D. Expression level of COR15a was detected by quantitative RT-PCR. Plants were grown at 22°C for 10 d under long days and then transferred to 4°C (cold+) or maintained at 22°C (cold-) for 0, 2, 4, and 6 h in the light. The zero time corresponds to right after dawn.
Figure 2.
Figure 2.
SOC1 Directly Represses CBF Expression. (A) Daily rhythm of CBF3 in wild-type (Col), soc1-2, and soc1-101D (101D) under long days. Expression level of CBF3 was detected by quantitative RT-PCR. The 10-d-old seedlings were harvested every 4 h for RNA isolation. (B) Cold response of CBF3 in wild-type, soc1-2, and soc1-101D. Expression level of CBF3 was detected by quantitative RT-PCR. Plants grown at 22°C for 10 d under long days were transferred to 4°C for 0, 2, and 6 h in the light. The quantitative RT-PCR analysis was biologically repeated three times, and each time point consisted of three technical replicates in both (A) and (B). The error bars represent sd for three technical replicates. (C) Four graphic bars represent the promoters of CBF1, CBF2, CBF3, and LFY. The arrowheads denote putative CArG box, and black lines (a-f, ProLFY-1, ProLFY-4) indicate the regions used for ChIP. (D) ChIP assay with SOC1 antibody. Enrichment of CBFs promoters (a to f) was confirmed by ChIP-PCR. ProLFY-1 was used as a positive control, and ProLFY-4 was used as a negative control. (E) Quantitative real-time PCR analysis using the same ChIP-PCR products in (D). Values are normalized against soc1-2 and are means of triplicate experiments with error bars representing sd. Negative controls, pTUB and CHS, are shown at right.
Figure 3.
Figure 3.
CBFs Positively Regulate FLC Expression. (A) Flowering time of wild-type (Wassilewskija) and CBF overexpression lines. Thirty plants were used to measure the flowering time, and the error bars represent sd. (B) Expression levels of COR15a, FLC, SVP, and FLM were determined by quantitative RT-PCR. (C) Suppression of FLC expression in CBF overexpression lines by vernalization. Expression level of FLC was detected by quantitative RT-PCR. (D) Flowering time of CBF overexpression lines without or with 40 d of vernalization. Plants with −Vernalization were grown at 22°C for 9 d under long days, whereas plants with +Vernalization were grown at 22°C for 5 d under long days and then transferred to 4°C for 40 d.
Figure 4.
Figure 4.
Effect of Intermittent Cold on Flowering. (A) Comparison of COR15a expressions between plants grown with (Cold +) and without (Cold −) intermittent cold (4°C). Expression level of COR15a was detected by quantitative RT-PCR. Intermittent cold treatments were for 6 h from dawn every day. For RNA isolation, the 10-d-old seedlings were harvested at 0, 4, 6, 8, 12, 16, and 24 h after dawn. (B) Expression level of CBF3 detected by quantitative RT-PCR. The quantitative RT-PCR analysis was biologically repeated three times, and each time point consisted of three technical replicates in both (A) and (B). The error bars represent sd for three technical replicates. (C) The schematics of intermittent cold treatment. The white bars represent normal growth conditions, and the black bars represent intermittent cold treatment. (D) Effect of intermittent cold treatment length on the flowering time. (E) Effect of intermittent cold treatment length on the expression of FLC and SVP. Expression level of FLC and SVP was detected by quantitative RT-PCR. Col plants grown 20 d in each condition were harvested at 6 h after dawn for RNA isolation. (F) The effect of intermittent cold on the flowering time of each mutant. The mutants of soc1-101D, soc1-2, and svp-41 in the left graph are in the Col background, whereas the flc-3 mutants in the right graph are in the Col:FRISF2 background. Plants were treated with (gray bars, Cold +) or without (white bars, Cold −) intermittent cold for 6 h from the dawn every day until they flowered.
Figure 5.
Figure 5.
Comparison of Vernalization and Intermittent Cold. (A) Expression levels of CBF1, CBF3, COR15a, and FLC in Col:FRISF2 grown with intermittent cold (4°C) for 6 h every day (Cold +) or with 40 d of vernalization (Ver +). The quantitative RT-PCR analysis was biologically repeated three times, and each time consisted of three technical replicates. The error bars represent sd from triplicate samples. (B) Effect of vernalization and intermittent cold on the flowering time of Col:FRISF2. Thirty plants were used to measure the flowering time, and the error bars represent sd.
Figure 6.
Figure 6.
Effect of soc1 Mutations on Freezing Tolerance. (A) The freezing-tolerance of soc1-2 and soc1-101D (101D) plants compared with wild-type plants. Experiments were performed in triplicate, and percentage of the plants survived was calculated: n ≥ 30. Mean values and standard errors were plotted. The * and ** denote statistical significance with P < 0.05 and P < 0.01 (Student's t test), respectively. (B) Sample plates showing plants subjected to freezing tolerance assays. Each plate contains 10 plants per line. The numbers on the plate to the right denote the number of plants that survived after freezing.
Figure 7.
Figure 7.
Expression of COR15a Is Regulated by Other Flowering Time Genes. (A) RNA gel blot analysis of COR15a in various late-flowering mutants in Col background. TUB2 probe was used as a loading control. (B) RNA gel blot analysis of COR15a in fpa-1, fve-1, and gi-1 mutants in Landsberg erecta background. (C) RNA gel blot analysis of CBF1 in Col, soc1-2, fve-3, and gi-2. (D) RNA gel blot analysis of COR15a in double mutants with soc1-2. (E) RNA gel blot analysis of COR15a in double mutants with soc1-101D. Total RNAs were presented as quantitative control for RNA gel blot analysis in (B) to (E).
Figure 8.
Figure 8.
Model of Crosstalk between Cold Response and Flowering Time Regulation. Arrows indicate promotion, and T bars indicate repression. In cold early spring or fall, the expression of CBF genes is activated by the cold signal, and the increased CBFs activate FLC expression, which eventually delays flowering time. By contrast, in warm late spring, floral induction occurs and the increased SOC1, GI, FVE, and FPA suppress the CBF-dependent cold response pathway.

References

    1. Ausin, I., Alonso-Blanco, C., Jarillo, J.A., Ruiz-Garcia, L., and Martinez-Zapater, J.M. (2004). Regulation of flowering time by FVE, a retinoblastoma-associated protein. Nat. Genet. 36 162–166. - PubMed
    1. Balasubramanian, S., Sureshkumar, S., Lempe, J., and Weigel, D. (2006). Potent induction of Arabidopsis thaliana flowering by elevated growth temperature. PLoS Genet. 2 980–989. - PMC - PubMed
    1. Bastow, R., Mylne, J.S., Lister, C., Lippman, Z., Martienssen, R.A., and Dean, C. (2004). Vernalization requires epigenetic silencing of FLC by histone methylation. Nature 427 164–167. - PubMed
    1. Baurle, I., and Dean, C. (2006). The timing of developmental transitions in plants. Cell 125 655–664. - PubMed
    1. Blazquez, M.A., Ahn, J.H., and Weigel, D. (2003). A thermosensory pathway controlling flowering time in Arabidopsis thaliana. Nat. Genet. 33 168–171. - PubMed

Publication types

MeSH terms

Substances