. 2009 Dec;104(7):1373-87.
doi: 10.1093/aob/mcp255. Epub 2009 Oct 13.

The role of callose in guard-cell wall differentiation and stomatal pore formation in the fern Asplenium nidus

Affiliations

The role of callose in guard-cell wall differentiation and stomatal pore formation in the fern Asplenium nidus

P Apostolakos et al. Ann Bot. 2009 Dec.

Abstract

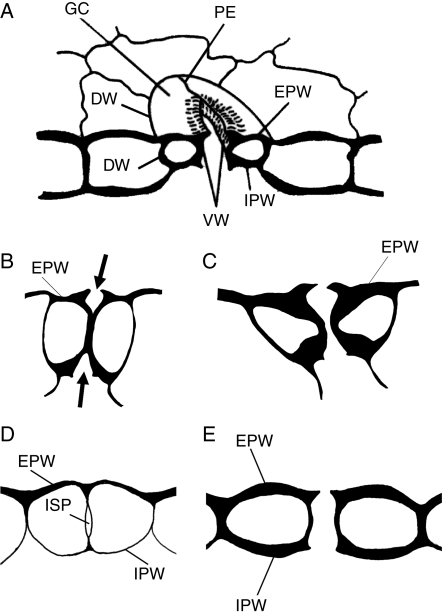
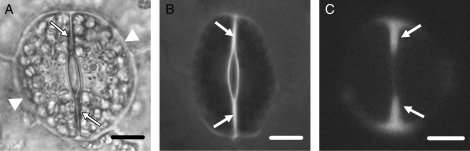
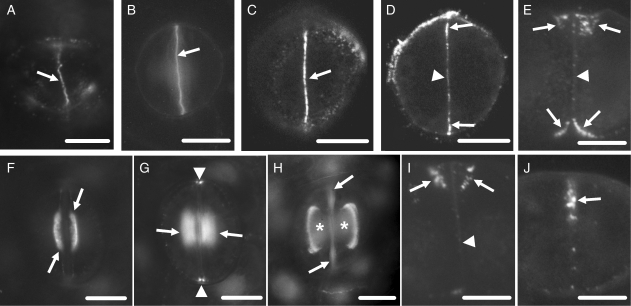
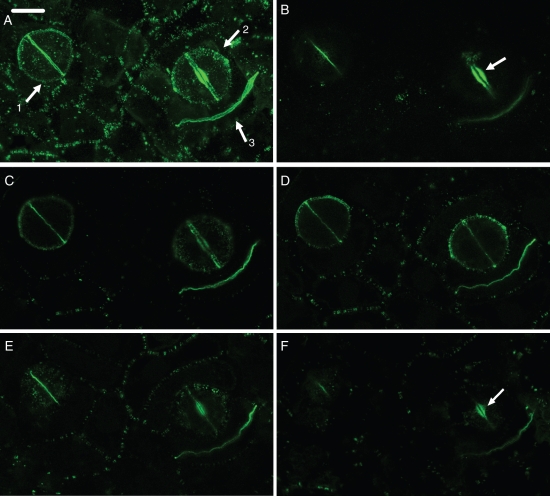
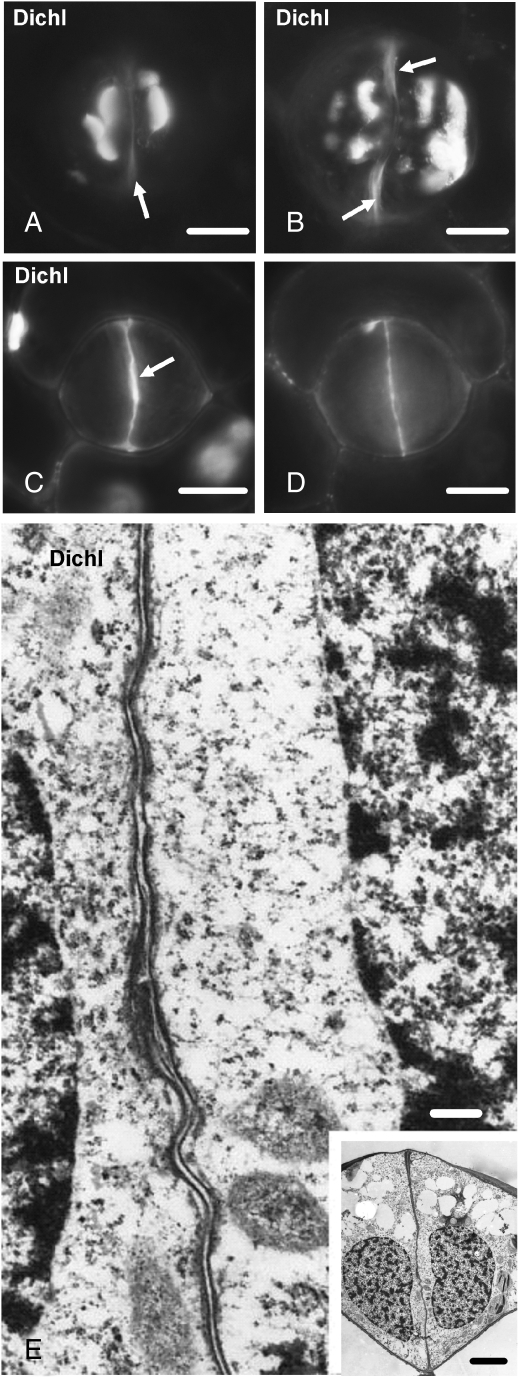
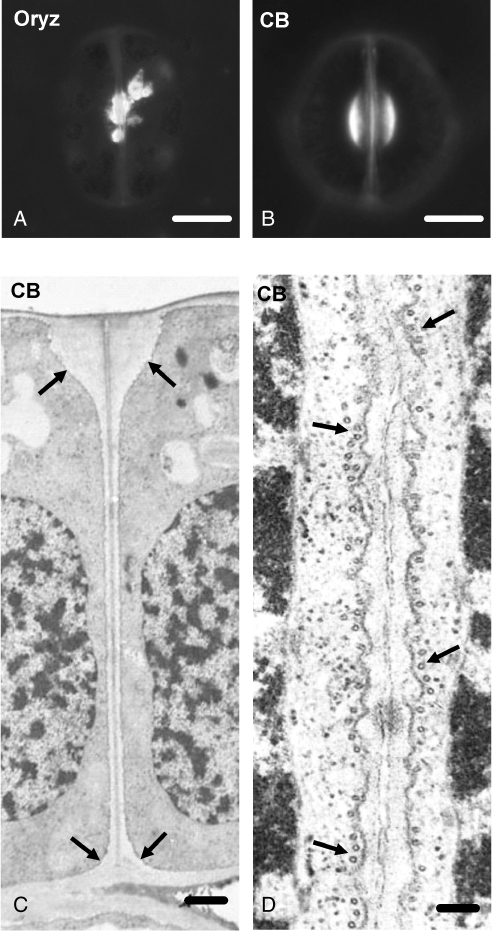
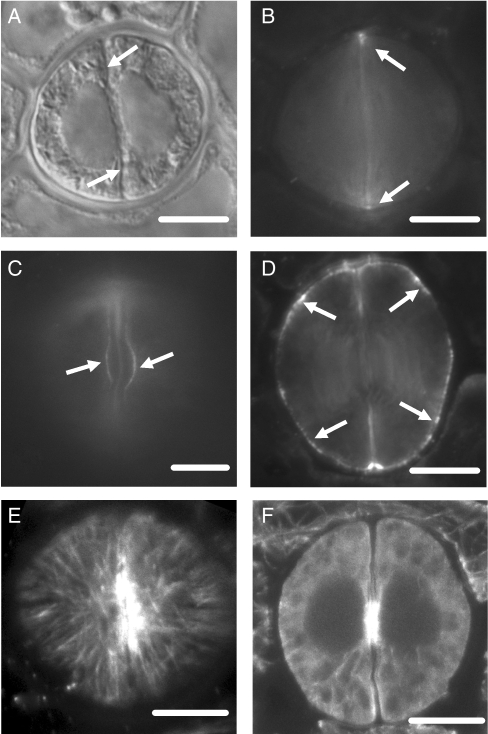
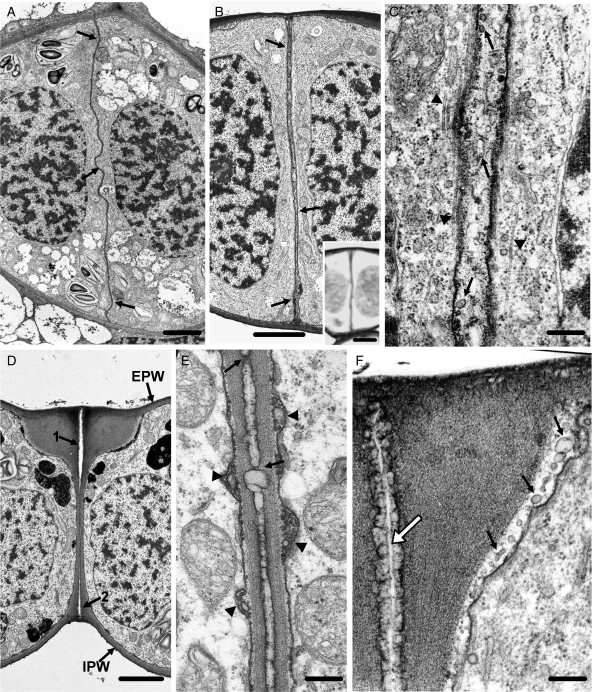
Background and aims: The pattern of callose deposition was followed in developing stomata of the fern Asplenium nidus to investigate the role of this polysaccharide in guard cell (GC) wall differentiation and stomatal pore formation.

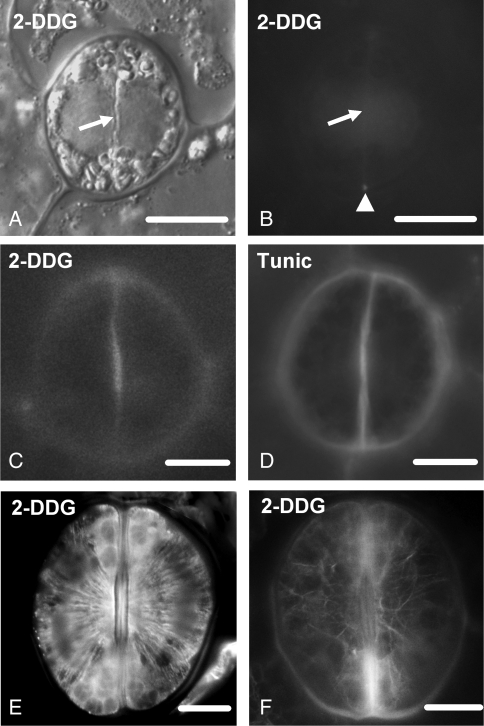
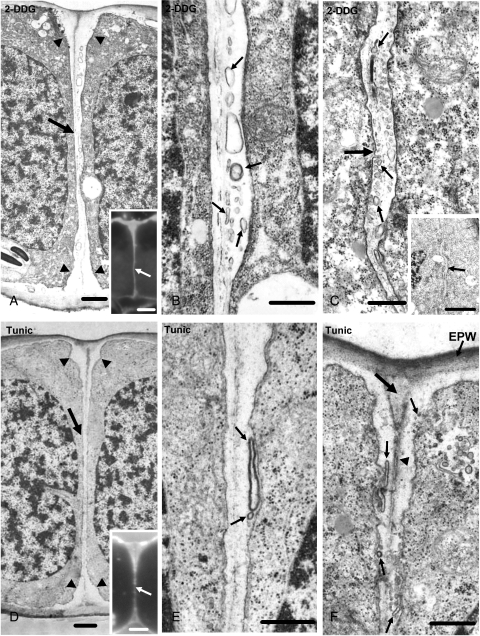
Methods: Callose was localized by aniline blue staining and immunolabelling using an antibody against (1 --> 3)-beta-d-glucan. The study was carried out in stomata of untreated material as well as of material treated with: (1) 2-deoxy-d-glucose (2-DDG) or tunicamycin, which inhibit callose synthesis; (2) coumarin or 2,6-dichlorobenzonitrile (dichlobenil), which block cellulose synthesis; (3) cyclopiazonic acid (CPA), which disturbs cytoplasmic Ca(2+) homeostasis; and (d) cytochalasin B or oryzalin, which disintegrate actin filaments and microtubules, respectively.

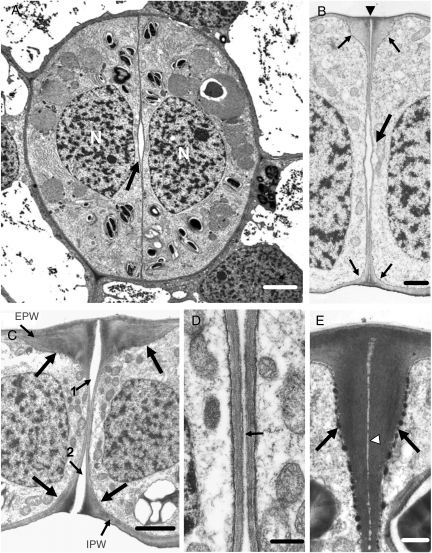
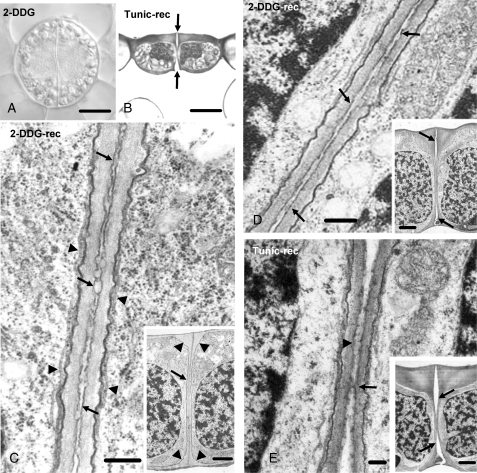
Results: In post-cytokinetic stomata significant amounts of callose persisted in the nascent ventral wall. Callose then began degrading from the mid-region of the ventral wall towards its periphery, a process which kept pace with the formation of an 'internal stomatal pore' by local separation of the partner plasmalemmata. In differentiating GCs, callose was consistently localized in the developing cell-wall thickenings. In 2-DDG-, tunicamycin- and CPA-affected stomata, callose deposition and internal stomatal pore formation were inhibited. The affected ventral walls and GC wall thickenings contained membranous elements. Stomata recovering from the above treatments formed a stomatal pore by a mechanism different from that in untreated stomata. After coumarin or dichlobenil treatment, callose was retained in the nascent ventral wall for longer than in control stomata, while internal stomatal pore formation was blocked. Actin filament disintegration inhibited internal stomatal pore formation, without any effect on callose deposition.

Conclusions: In A. nidus stomata the time and pattern of callose deposition and degradation play an essential role in internal stomatal pore formation, and callose participates in deposition of the local GC wall thickenings.


Figures

Fig. 1.
Fig. 1.
(A) Diagrammatic representation of an elliptical stoma. (B–E) Diagram to show the process of stomatal pore formation in angiosperms (B, C) and some Polypodiales ferns (D, E). The arrows in (B) indicate the forming stomatal pore. Abbreviations: DW, dorsal wall; EPW, external periclinal wall; GC, guard cell; IPW, internal periclinal wall; ISP, internal stomatal pore; PE, polar ventral wall end; VW, ventral wall.
Fig. 2.
Fig. 2.
(A) Light micrograph of a control living stoma. The arrows mark the ventral wall and the arrowheads the dorsal walls. Scale bar = 10 µm. (B, C) Epifluorescence microscope images of unstained control stomata showing the guard cell wall regions emitting autofluorescence. (B) Stoma observed under the filter with exciter G 365 and barrier LP 420. (C) Stoma observed under the filter with exciter BP 450–490 and barrier BP 515–565. The arrows point to cell-wall regions exhibiting UV autofluorescence. Scale bars = 10 µm.
Fig. 3.
Fig. 3.
Callose localization in developing control stomata after immunolabelling (A, C–J) or aniline blue staining (B). Scale bars = 10 µm. (A) Cytokinetic guard cell mother cell. The arrow indicates the cell plate. (B) Post-cytokinetic stoma. The nascent ventral wall (arrow) exhibits intense callose fluorescence. (C, D) Single CLSM sections through the junction of the ventral wall with the external periclinal walls (C) and a median plane (D) of a stoma in which the internal stomatal pore has been initiated. The margins of the ventral wall (arrows in C and D) exhibit intense callose fluorescence and a less intense one at its median region (arrowhead in D). (E) Median transverse semi-thin section of a stoma, in which stomatal pore formation and wall thickening deposition have started. Wall thickenings containing callose emerge at the junctions of the ventral wall with the periclinal walls (arrows; cf. Fig. 5B). The rest of the ventral wall (arrowhead) lacks callose. (F, G) Optical sections through a surface (F) and an inner plane (G) of a stoma at an early stage of wall thickening. Callose impregnates the wall thickenings at the stomatal pore region (arrows in F and G) and at the junctions of the ventral wall with the dorsal walls (arrowheads in G). (H) Stoma at a more advanced stage of differentiation than that shown in F and G. Callose is detected at the margins of the wall thickenings (asterisks) at the stomatal pore region. The arrows point to ventral wall regions displaying autofluorescence (cf. Fig. 2C). (I) Median transverse semi-thin section of a stoma at the same differentiation stage as that of the stoma shown in (H). Callose is located at the margins of the wall thickenings (arrows). The rest of the ventral wall lacks callose (arrowhead). (J) Transverse semi-thin section of a ventral wall polar end (see Fig. 1A). Callose (arrow) is deposited at the wall thickening developing in this area (cf. Fig. 5E).
Fig. 4.
Fig. 4.
(A–F) Paradermal CLSM view of control stomata at an early (arrow 1 in A) and a more advanced (arrow 2 in A) stage of differentiation and a dividing ordinary protodermal cell (arrow 3 in A), after callose immunolocalization. In stoma No. 1 the internal stomatal pore has been initiated, while in stoma No. 2 the deposition of wall thickening has started. (A) Figure produced by projection of 51 CLSM sections. (B–F) Figures produced by projection of four consecutive CLSM sections each. (B) Plane close to the external periclinal walls. (C, D) Median planes. (E, F) Planes close to the internal periclinal walls. For determination of the external and internal periclinal walls see Fig. 1A. The ventral wall emits intense callose fluorescence at regions close to the periclinal walls (B, E), while the nascent daughter wall of the protodermal cell emits intense callose fluorescence at central regions (C, D). The arrows in (B) and (F) indicate the wall thickenings at the stomatal pore region. Scale bar = 10 µm.
Fig. 5.
Fig. 5.
Untreated stomata as appear in TEM. (A) Median paradermal section of a stoma in which the internal stomatal pore (arrow) has been initiated. N, nucleus. Scale bar = 2 µm. (B) Median transverse section of a stoma at a differentiation stage similar to that of the stoma shown in (A). The large arrow points to the internal stomatal pore, while the small arrows point to the wall thickenings deposited at the external and internal stomatal pore region. The arrowhead marks the initiating fore-chamber of the stomatal pore. Scale bar = 1 µm. (C) Median transverse section of a stoma at a later stage of differentiation than that of the stoma shown in (B). Large arrows show the wall thickenings at the stomatal pore region, whereas the small arrows 1 and 2 show the fore- and rear-pore chamber, respectively. The periclinal wall covering the rear-pore chamber has been disrupted. EPW, external periclinal wall; IPW, internal periclinal wall. Scale bar = 2 µm. (D) Median ventral wall region of the stoma shown in (C) at higher magnification. The stomatal pore (arrow) appears as a slit between the adjacent ventral walls. Scale bar = 500 nm. (E) Transverse view of a polar ventral wall end. For determination of the polar ventral wall end see Fig. 1A. The arrows mark the wall thickenings, while the arrowhead marks the middle lamella. Scale bar = 500 nm.
Fig. 6.
Fig. 6.
(A) Differential interference contrast optical view of a post-cytokinetic 2-DDG-affected stoma. The arrow shows the nascent ventral wall. (B) The stoma after callose localization with aniline blue staining. The nascent ventral wall (arrow) does not display callose fluorescence (cf. Fig. 3B). Weak callose fluorescence is emitted by the junctions of the ventral wall with the dorsal walls (arrowhead). Treatment: 1 mm 2-DDG for 48 h. Scale bar = 10 µm. (C, D) Callose localization after aniline blue staining in a 2-DDG- (C) and a tunicamycin-affected (D) differentiating stoma. Treatments: (C) 1 mm 2-DDG for 48 h; (D) 24 µm tunicamycin for 48 h. Scale bars = 10 µm. (E, F) Microtubule immunolabelling (E) and actin filament staining (F) with Alexa Fluor 568 phalloidin in 2-DDG-affected differentiating stomata. Treatment: 500 µm 2-DDG for 72 h. Scale bars = 10 µm.
Fig. 7.
Fig. 7.
TEM micrographs of stomata treated with callose synthesis inhibitors, showing the inhibition of internal stomatal pore formation. Treatments: (A–C) 1 mm 2-DDG for 48 h; (D–F) 12 µm tunicamycin for 48 h. (A) Median transverse section of a 2-DDG-affected stoma, which is at a stage of differentiation similar to that of the stomata shown in Fig. 5A and B. The arrow points to the aberrant ventral wall and the arrowheads to its atypical wall thickenings. Inset: median transverse semi-thin section of a 2-DDG-affected stoma at the same stage of differentiation as that of the stoma illustrated in (A), after calcofluor staining. The ventral wall (arrow) fluoresces along its whole depth. Scale bars: (A) = 1 µm; inset = 5 µm. (B) Higher magnification of the median ventral wall region of the stoma shown in (A). The apoplast contains numerous membranous elements (arrows). Scale bar = 500 nm. (C) Paradermal section through the wall thickening (large arrow) deposited at the junction of the middle of the ventral wall with the periclinal walls in a 2-DDG-affected stoma. Note the numerous membranous elements (small arrows) in the wall thickening. Inset: the arrow points to the wall thickening shown in (C) at higher magnification. Scale bars: (C) = 500 nm; inset = 5 µm. (D) Median transverse section of a tunicamycin-affected stoma at a stage of differentiation similar to that of the stomata illustrated in Fig. 5A and B. The arrow shows the ventral wall and the arrowheads the wall thickenings at their junctions with the periclinal walls. Inset: median transverse semi-thin section of a tunicamycin-affected stoma at a stage of differentiation similar to that of the stoma illustrated in (D), after calcofluor staining. The ventral wall (arrow) fluoresces along its whole length. Scale bars: D = 1 µm; inset = 5 µm. (E, F) The median portion (E) of the ventral wall of the stoma shown in (D) and the junction of this wall with the external periclinal wall (F) at higher magnification. Note the membranous elements in the apoplast (small arrows). The arrowhead in (F) points to the middle lamella, while the large arrow points to the site of the future fore-chamber of the stomatal pore. EPW, external periclinal wall. Scale bars = 500 nm.
Fig. 8.
Fig. 8.
(A) Differential interference contrast image of a 2-DDG-affected differentiating stoma. Treatment: 1 mm 2-DDG for 5 d. Scale bar = 10 µm. (B) Median transverse semi-thin section of a tunicamycin-affected stoma recovering under control conditions. This stoma, as well as those illustrated in (C–E), after treatment was placed in distilled water. The arrows point to the forming stomatal pore. Treatment: 12 µm tunicamycin for 5 d; recovery 7 d. Scale bar = 10 µm. (C) Higher magnification of a median transverse ventral wall section of a 2-DDG-affected stoma (inset), recovering under control conditions. The arrows in (C) mark the differentiated middle lamella, while the arrowheads mark microtubules. The arrow in the inset indicates the ventral wall and the arrowheads the wall thickenings. Treatment: 500 µm 2-DDG for 5 d; recovery 7 d. Scale bars: (C) = 250 nm; inset = 2·5 µm. (D) Median transverse ventral wall section of a 2-DDG-affected stoma (inset) recovering under control conditions. This stoma is at a more advanced stage of differentiation than that of the stoma shown in (C, inset). The fore- and rear-chamber of the stomatal pore have been formed (arrows in inset). The arrows in (D) mark the differentiated middle lamella. Treatment: 500 µm 2-DDG for 5 d; recovery 7 d. Scale bars: (D) = 250 nm; inset = 2·5 µm. (E) Median transverse ventral wall section of a tunicamycin-affected stoma (inset) recovering under control conditions, which is at a more advanced stage of differentiation than that of the stoma shown in (D, inset). The stomatal pore is at final stages of formation. The fore- and rear stomatal pore chambers (arrows in inset) have expanded towards the middle of the ventral wall. Note the material localized at the region of ventral walls that have not yet been separated (arrowhead in E). The arrow in (E) indicates a wall bridge connecting the adjacent ventral walls. Treatment: 12 µm tunicamycin for 5 d; recovery 7 d. Scale bars: (E) = 125 nm; inset = 2·5 µm.
Fig. 9.
Fig. 9.
Dichlobenil-affected stomata as they appear after aniline blue staining (A–D) or under TEM (E). Treatments: (A–E) 100 µm dichlobenil for 48 h. (A, B) Affected stomata at successive stages of differentiation. Atypical callose depositions can be seen at various sites of the periclinal walls. The arrows show regions of the ventral wall exhibiting autofluorescence (cf. Fig. 2B). Scale bars = 10 µm. (C, D) Optical sections through an external (C) and a median plane (D) of an affected stoma, which is at a stage of differentiation similar to that of the stoma shown in Fig. 3C and D. The external (C) and the median (D) region of the ventral wall emit intense callose fluorescence. The arrow in (C) indicates the initiating wall thickening at the junction of the ventral wall with the external periclinal wall. Scale bar = 10 µm. (E) Higher magnification of the median ventral wall region of the stoma shown in the inset. The internal stomatal pore has not been formed (cf. Fig. 5B). Inset: median transverse section of an affected stoma, which is at a stage of differentiation similar to that of the stomata shown in Fig. 5A and B. Note the absence of the wall thickenings at the sites of junction of the ventral wall with the periclinal walls (cf. Fig. 5B). Scale bars: (E) = 250 nm; inset = 5 µm.
Fig. 10.
Fig. 10.
Stomata treated with anti-cytoskeletal drugs as they appear after aniline blue staining (A, B) or under TEM (C, D). (A) Oryzalin-affected differentiating stoma exhibiting aberrant callose depositions at the stomatal pore region. The stage of differentiation of this stoma is similar to that of the stoma shown in Fig. 3F. Treatment: 50 µm oryzalin for 2 h. Scale bar = 10 µm. (B) Cytochalasin B-affected stoma, which is at a stage of differentiation similar to that of the stoma shown in Fig. 3F. The callose depositions at the stomatal pore region resemble those of the control stomata (cf. Figs 3F and 4A). Treatment: 100 µm cytochalasin B for 48 h. Scale bar = 10 µm. (C) Median transverse section of a cytochalasin B-affected stoma that is at a stage of differentiation similar to that of the stoma illustrated in Fig. 5B. The wall thickenings at the junctions of the ventral wall with the periclinal walls (arrows) do not differ from those of the untreated stomata. Stomatal pore formation has been inhibited (cf. Fig. 5B). Note the presence of the middle lamella along the ventral wall. Treatment: 100 µm cytochalasin B for 60 h. Scale bar = 1 µm. (D) Higher magnification of a median ventral wall region of a young cytochalasin B-affected stoma in paradermal view. Note the absence of the internal stomatal pore (cf. Fig. 5A). The arrows point to microtubules. Treatment: 100 µm cytochalasin B for 60 h. Scale bar = 125 nm.
Fig. 11.
Fig. 11.
CPA-affected stomata as they appear after callose (A–D) or microtubule (E, F) immunolocalization. Treatments: (A–F) 25 µm CPA for 24 h. (A) Differential interference contrast optical view of a post-cytokinetic affected stoma. (B) The stoma after callose immunolocalization. The nascent ventral wall (arrows in A) does not display callose fluorescence (B; cf. Figs 3B and 4A). Weak callose fluorescence is seen at the junction of the ventral wall with the dorsal walls (arrows in B). Scale bar = 10 µm. Optical sections through the external (C) and a median (D) plane of two affected stomata, which are at a differentiation stage similar to that of stomata shown in Fig 3F and H. Weak callose fluorescence is emitted by the stomatal pore region (arrows in C; cf. Fig. 3F, H) and by various positions of the dorsal walls (arrows in D). Scale bars = 10 µm. CLSM sections through the cortical cytoplasm below the external periclinal wall (E) and through a median plane (F) of an affected stoma at an early stage of differentiation, showing the microtubule organization. Scale bar = 10 µm.
Fig. 12.
Fig. 12.
TEM micrographs of CPA-affected stomata, in which internal stomatal pore formation has been inhibited. Treatments: (A–F) 25 µm CPA for 24 h. (A) Paradermal view through the middle of a post-cytokinetic affected stoma. The ventral wall (arrows) is wavy and lacks an internal stomatal pore (cf. Fig. 5A). Scale bar = 20 µm. (B) Median transverse section of an affected stoma at a stage of differentiation similar to that of the stoma depicted in Fig. 5B. The ventral wall (arrows) is atypically thickened and lacks an internal stomatal pore (cf. Fig. 5B). Inset: transverse semi-thin section of an affected stoma at a stage of differentiation similar to that of the stoma shown in (B), after PAS staining. The ventral wall and the periclinal walls are positively stained. Scale bars: (B) = 20 µm; inset = 5 µm. (C) Higher magnification of the median region of the ventral wall of the stoma shown in (B). The arrows show membranous elements at inner positions of the aberrant ventral wall and the arrowheads the microtubules. Scale bar = 250 nm. (D) Median transverse section of an affected stoma that is at a stage of differentiation more advanced than that of the stoma shown in (B). The arrows mark the initiating fore- (arrow 1) and rear- (arrow 2) chambers of the stomatal pore. EPW, external periclinal wall; IPW, internal periclinal wall. Treatment: 25 µm CPA for 24 h. Scale bar = 20 µm. (E) The median region of the ventral wall of the stoma shown in (D) at higher magnification. Note the absence of the internal stomatal pore (cf. Fig. 5C, D) and the material localized at the middle lamella. Wall bridges connect the adjacent ventral walls (arrows) and membranous elements are localized in the apoplast (arrowheads). Scale bar = 250 nm. (F) Wall thickening at the junction of the ventral wall with the external periclinal wall of a young affected stoma. The large arrow marks the initiated fore-pore chamber that is lined by a material similar to that localized in the middle lamella in (E). Note the membranous elements in the apoplast (small arrows). Scale bar = 250 nm.

Similar articles

Cited by

References

    1. van Amstel TNM, Kengen HMP. Callose deposition in the primary wall of suspension cells and regenerating protoplasts, and its relationship to patterned cellulose synthesis. Canadian Journal of Botany. 1996;74:1040–1049.
    1. Apostolakos P, Galatis B. Probable cytoskeleton involvement in stomatal pore formation in Asplenium nidus L. Protoplasma. 1998;203:48–57.
    1. Apostolakos P, Galatis B. Microtubule and actin filament organization during stomatal morphogenesis in the fern Asplenium nidus. II. Guard cells. New Phytologist. 1999;141:209–223. - PubMed
    1. Apostolakos P, Livanos P, Galatis B. Microtubule involvement in the deposition of radial fibrillar callose arrays in stomata of the fern Asplenium nidus L. Cell Motility and the Cytoskeleton. 2009;66:342–349. - PubMed
    1. Bulone V. In vitro synthesis and analysis of plant (1 → 3)-β-d-glucans and cellulose: a key step towards the characterization of glucan synthases. In: Brown RM Jr, Saxena IM, editors. Cellulose: molecular and structural biology. Heidelberg: Springer; 2007. pp. 123–145.

Publication types