. 2010 Feb;24(2):548-59.
doi: 10.1096/fj.09-141754. Epub 2009 Oct 13.

Massive gliosis induced by interleukin-6 suppresses Abeta deposition in vivo: evidence against inflammation as a driving force for amyloid deposition

Affiliations

Massive gliosis induced by interleukin-6 suppresses Abeta deposition in vivo: evidence against inflammation as a driving force for amyloid deposition

Paramita Chakrabarty et al. FASEB J. 2010 Feb.

Abstract

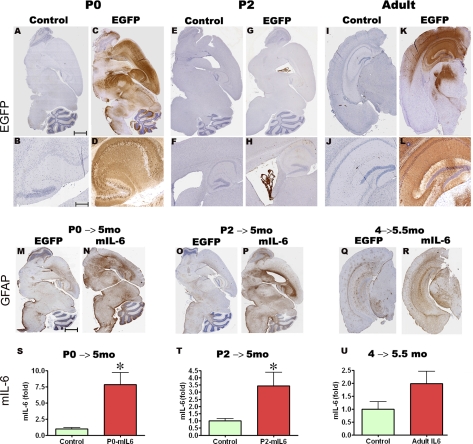
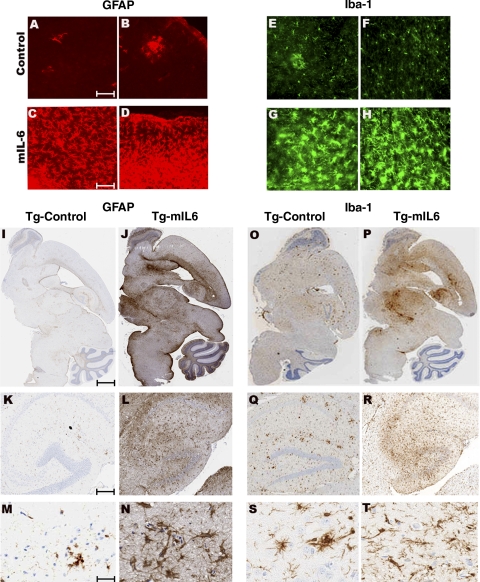
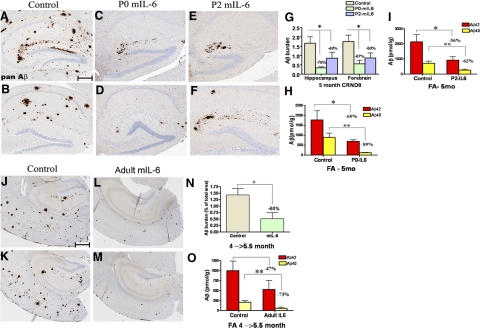
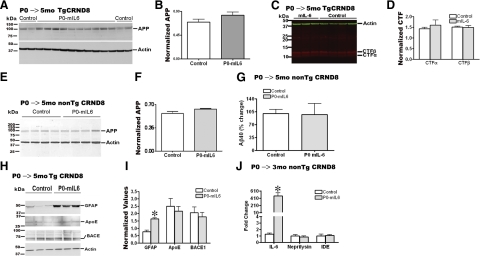
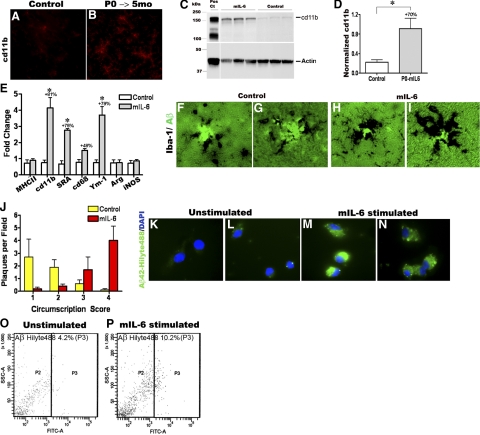
Proinflammatory stimuli, after amyloid beta (Abeta) deposition, have been hypothesized to create a self-reinforcing positive feedback loop that increases amyloidogenic processing of the Abeta precursor protein (APP), promoting further Abeta accumulation and neuroinflammation in Alzheimer's disease (AD). Interleukin-6 (IL-6), a proinflammatory cytokine, has been shown to be increased in AD patients implying a pathological interaction. To assess the effects of IL-6 on Abeta deposition and APP processing in vivo, we overexpressed murine IL-6 (mIL-6) in the brains of APP transgenic TgCRND8 and TG2576 mice. mIL-6 expression resulted in extensive gliosis and concurrently attenuated Abeta deposition in TgCRND8 mouse brains. This was accompanied by up-regulation of glial phagocytic markers in vivo and resulted in enhanced microglia-mediated phagocytosis of Abeta aggregates in vitro. Further, mIL-6-induced neuroinflammation had no effect on APP processing in TgCRND8 and had no effect on APP processing or steady-state levels of Abeta in young Tg2576 mice. These results indicate that mIL-6-mediated reactive gliosis may be beneficial early in the disease process by potentially enhancing Abeta plaque clearance rather than mediating a neurotoxic feedback loop that exacerbates amyloid pathology. This is the first study that methodically dissects the contribution of mIL-6 with regard to its potential role in modulating Abeta deposition in vivo.


Figures

Figure 1.
Figure 1.
AAV1-mediated transduction of mIL-6 in mouse brain results in widespread expression and robust gliosis. A–L) AAVI-EGFP (2×10⁹ genome particles/ventricle) was injected into the cerebral ventricles of TgCRND8 pups on day P0 (AD, P0) or P2 (EH, P2) or injected stereotaxically into the hippocampus of 4-mo-old mice (IL, Adult). Mice were then sacrificed after 4–6 wk (n=5/group). Age-matched controls were injected with saline in all cases. Representative images of whole-brain sections (top panels) and hippocampus (bottom panels) show widespread EGFP expression in both forebrain and hindbrain areas in P0-injected mice (AD), whereas P2 injection results in localized transduction of the choroid plexus (EH). AAVI-EGFP injection into the hippocampus of 4-mo-old mice results in transduction of the hippocampal pyramidal layer as well as neuronal projections in the cortex and thalamus (IL) at least 1 mm anterior and posterior to the point of injection. M–R) AAV1-mIL-6 or AAV1-EGFP (2×10⁹ genome particles/ventricle) was injected into the cerebral ventricles of TgCRND8 mice on either P0 (M, N; P0→5 mo) or P2 (O, P; P2→5 mo) and sacrificed after 5 mo (n=9–12/group). GFAP immunostaining shows increased astrogliosis in both P0 → 5 mo and P2 → 5 mo mIL-6-injected mice compared with EGFP-injected control mice. Stereotactic injection of AAV1 mIL-6 into the hippocampus of 4-mo TgCRND8 mice and analyzed after 6 wk (Q, R; 4→5.5 mo) shows increased astrogliosis (n=5–6/group). S–U) Levels of mIL-6 in injected mouse brains were analyzed using sandwich ELISA technique using RIPA-soluble brain lysates. Results are expressed as fold over control (n=5/group). *P < 0.05. Scale bars = 600 μm (A, C, E, G, M–P); 500 μm (I, K, Q, R); 150 μm (B, D); 250 μm (F, H); 125 μm (J, L).
Figure 2.
Figure 2.
AAV1-mIL-6 expression in transgenic CRND8 mice results in extensive induction of astrogliosis and microgliosis. A–H) Up-regulation of activated astrocytes (C, D; GFAP) and microglia (G, H; Iba-1) in the cortex of P0 → mIL-6-injected TgCRND8 mice compared with control TgCRND8 mice (A, B; GFAP; E, F; Iba-1) detected by immunofluorescent staining of free-floating fixed sections (GFAP, red; Iba-1, green). I–N) Reactive astrocytes (GFAP immunoreactivity) in paraffin-embedded sections of P0 → 5 mo TgCRND8 mice injected with either mIL-6 (Tg-mIL6) or EGFP (Tg-Control). Whole-brain sections (I, J) along with higher magnification pictures (KN, bottom panels) show detailed morphology of the activated astrocytes in and around the corresponding hippocampus. O–T) Iba-1 immunoreactivity in whole brain sections (OP) and higher magnifications of the hippocampus (QT, bottom panels) in P0 → 5 mo TgCRND8 mice. Abundant activated microglia displaying hypertrophic processes are present in mIL-6-injected mice (Tg-mIL6) compared with EGFP-expressing control mice (Tg-Control). Scale bars = 50 μm (A–H); 600 μm (I, J, O, P), 150 μm (K, L, Q, R), and 25 μm (M, N, S, T).
Figure 3.
Figure 3.
Attenuation of Aβ deposition in AAV1-mIL-6-expressing TgCRND8 mice. A–F). Representative brain sections stained with pan-Aβ1–16 antibody (mAb 33.1.1) show Aβ plaque immunoreactivity in the hippocampus of P0 → 5 mo mIL-6-expressing (C, D; P0-mIL-6), P2 → 5 mo mIL-6-expressing (E, F; P2-mIL-6), and age-matched P0 → 5 mo EGFP-expressing TgCRND8 mice (A, B; Control). G) There was a significant decrease in total forebrain Aβ as well as hippocampal Aβ plaque burdens in both P0 → 5 mo and P2 → 5 mo injection groups compared with control mice. H–I) Biochemical analyses of FA extractable Aβ42 and Aβ40 levels in P0 → 5 mo mIL-6-expressing TgCRND8 mice (H) and P2 → 5 mo mIL-6-expressing CRND8 mice (I) compared with EGFP-expressing age matched controls. J–M) 4-mo-old TgCRND8 mice were stereotaxically injected in the hippocampus with either AAV1-mIL-6 or AAV1-EGFP and sacrificed after 6 wk (n=5–6/group). Representative brain sections stained with 33.1.1 antibody (pan-Aβ 1–16) depict attenuation of Aβ deposition in mIL-6-expressing mice (L, M; Adult mIL-6) compared with controls (J, K; Control) in the immediate vicinity of the injection site. N) Aβ plaque burden analysis shows a significant decrease in amyloid deposition in mIL-6-injected mice compared with control EGFP-injected mice O) Biochemical analyses of Aβ42 and Aβ40 levels by ELISA show significant reductions in FA fraction in mIL-6-injected mice compared with controls. *P < 0.05; **P < 0.05. Scale bars = 150 μm.
Figure 4.
Figure 4.
APP-processing, Aβ-production, or Aβ-degradation enzymes are not significantly altered in AAV1-mIL-6-expressing mice. A) Representative anti-CT20 immunoblot showed no significant changes in APP levels in AAV1-mIL-6-expressing P0 → 5 mo TgCRND8 compared with age-matched controls. B) Intensity analysis of anti-CT20 immunoreactive APP levels was normalized to β-actin in P0 → 5 mo TgCRND8 mouse cohort. C) Representative anti-CT20 immunoblot analysis of CTFα and CTFβ levels showed no significant changes in P0 → 5 mo TgCRND8 mice injected with AAV1-mIL-6 compared with age-matched controls. D). Intensity analysis of anti-CT20 immunoreactive CTF bands was normalized to β-actin in P0 → 5 mo TgCRND8 mouse cohort. E) Representative immunoblot showed no significant changes in APP levels in P0 → 5 mo mIL-6-expressing nontransgenic CRND8 littermates compared with age-matched controls. F). Intensity analysis of anti-CT20 immunoreactive APP levels was normalized to β-actin in P0 → 5 mo nontransgenic CRND8 mouse cohort. G) No change in diethylamine-soluble endogenous Aβ40 levels was seen in mIL-6-expressing P0 → 5 mo nontransgenic CRND8 littermates compared with age-matched controls. H) Representative immunoblot analysis of GFAP, ApoE, and BACE1 using RIPA-soluble lysates of P0 → 5 mo TgCRND8 mice showed minimal changes in ApoE or BACE1 levels (n=3/group), whereas GFAP reactivity was significantly increased in mIL-6-expressing mice. I) Intensity analysis of GFAP, ApoE, and BACE1 levels was quantified after normalization to β-actin levels in P0 → 5 mo TgCRND8 mouse cohort. *P < 0.05. J) Quantitative RT-PCR analysis of mRNA levels of Aβ degrading enzymes Neprilysin and IDE in mIL-6-expressing mouse forebrain. Data (fold change over control) represent average values obtained by quantitative PCR on 3-mo-old non-Tg CRND8 mice injected with AAV1-EGFP (control) or AAV1-mIL-6 on P0. Data reflect 2 independent experiments; n = 4 mice/group. *P < 0.001.
Figure 5.
Figure 5.
mIL6-induced persistent microglial up-regulation results in efficacious plaque clearance. A, B) Analysis of cd11b/Mac in mIL-6-expressing P0 → 5 mo TgCRND8 mice (n=3–4/group). Representative image showing up-regulation of cd11b/Mac in mIL-6-expressing TgCRND8 mice (B) compared with controls (A) detected by immunofluorescent staining on free-floating fixed sections. View ×200. C) Representative immunoblot analysis of cd11b in RIPA soluble brain extracts from mIL-6-injected P0 → 5 mo TgCRND8 mice compared with age-matched controls. D) Quantitative analysis of cd11b immunoblotting after normalizing to β-actin levels. *P < 0.05. E) Quantitative RT-PCR analysis of levels of microglial markers in mIL-6-expressing mouse forebrain. Data (fold change over control) represent average values obtained by QPCR on 3-mo-old mice injected with AAV1-EGFP (control) or AAV1-mIL-6 on P0; 2 independent experiments; n = 4 mice/group. *P < 0.001; 2-way ANOVA with Bonferroni’s posttests. F–I) Representative images of thioflavin-S-stained Aβ plaques (fluorescent green labeling) decorated with Iba-1 immunoreactive microglia (black immunostain) in mIL-6-expressing P0 → 5 mo TgCRND8 mice (H, I) and controls (F, G). View ×400. J) Quantitative analysis of the extent of Iba-1 immunodeposits circumscribing individual plaques shows increased association of activated microglia with plaques in mIL-6-expressing P0 → 5 mo TgCRND8 mice compared with controls (n = 4–5 mice/group). K–N) mIL-6-treated primary microglia appear to be more efficient in the uptake of fAβ42-Hilyte488 (green fluorescence, M, N) compared with unstimulated glia (K, L). Blue fluorescence indicates DAPI-stained glial nuclei. Data from 2 independent experiments; view ×600. O–P) Microglial cells with internalized Aβ42-Hilyte 488 (FITC channel on x-axis) were quantified by FACS. Percentage of positive cells in mIL-6 stimulated microglial cells was 10.2% (P, P3) compared with 4.2% in control unstimulated cells (O, P3).

References

    1. Wyss-Coray T. Inflammation in Alzheimer disease: driving force, bystander or beneficial response? Nat Med. 2006;12:1005–1015. - PubMed
    1. Akiyama H, Barger S, Barnum S, Bradt B, Bauer J, Cole G M, Cooper N R, Eikelenboom P, Emmerling M, Fiebich B L, Finch C E, Frautschy S, Griffin W S, Hampel H, Hull M, Landreth G, Lue L, Mrak R, Mackenzie I R, McGeer P L, O'Banion M K, Pachter J, Pasinetti G, Plata-Salaman C, Rogers J, Rydel R, Shen Y, Streit W, Strohmeyer R, Tooyoma I, Van Muiswinkel F L, Veerhuis R, Walker D, Webster S, Wegrzyniak B, Wenk G, Wyss-Coray T. Inflammation and Alzheimer’s disease. Neurobiol Aging. 2000;21:383–421. - PMC - PubMed
    1. Ringheim G E, Szczepanik A M, Petko W, Burgher K L, Zhu S Z, Chao C C. Enhancement of beta-amyloid precursor protein transcription and expression by the soluble interleukin-6 receptor/interleukin-6 complex. Brain Res Mol Brain Res. 1998;55:35–44. - PubMed
    1. Griffin W S, Sheng J G, Royston M C, Gentleman S M, McKenzie J E, Graham D I, Roberts G W, Mrak R E. Glial-neuronal interactions in Alzheimer’s disease: the potential role of a “cytokine cycle” in disease progression. Brain Pathol. 1998;8:65–72. - PMC - PubMed
    1. Gao H M, Jiang J, Wilson B, Zhang W, Hong J S, Liu B. Microglial activation-mediated delayed and progressive degeneration of rat nigral dopaminergic neurons: relevance to Parkinson’s disease. J Neurochem. 2002;81:1285–1297. - PubMed

Publication types

LinkOut - more resources