. 2009 Oct 15;69(20):8067-75.
doi: 10.1158/0008-5472.CAN-09-0901. Epub 2009 Oct 13.

Kupffer cell suppression of CD8+ T cells in human hepatocellular carcinoma is mediated by B7-H1/programmed death-1 interactions

Affiliations

Kupffer cell suppression of CD8+ T cells in human hepatocellular carcinoma is mediated by B7-H1/programmed death-1 interactions

Ke Wu et al. Cancer Res. .

Abstract

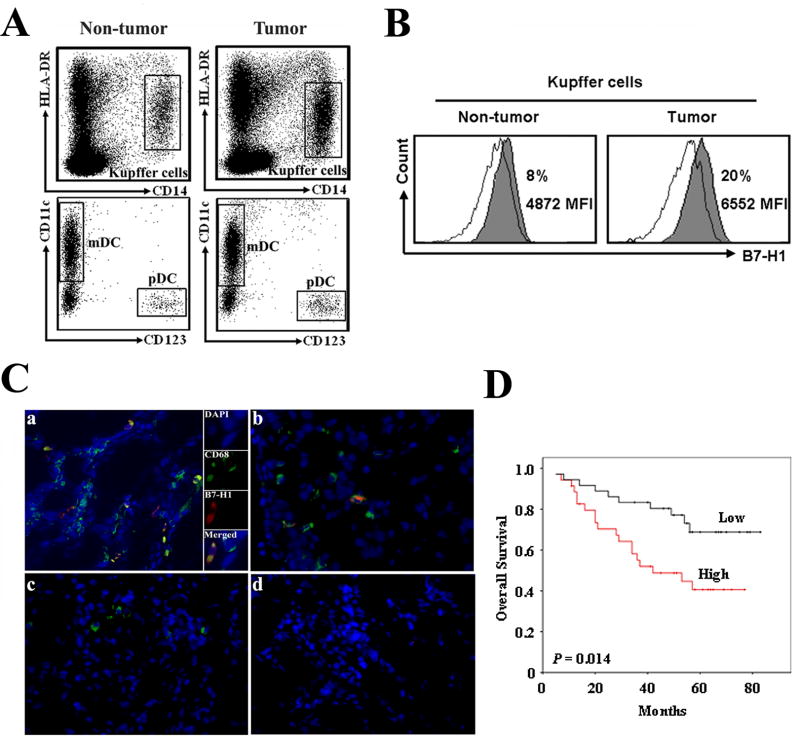
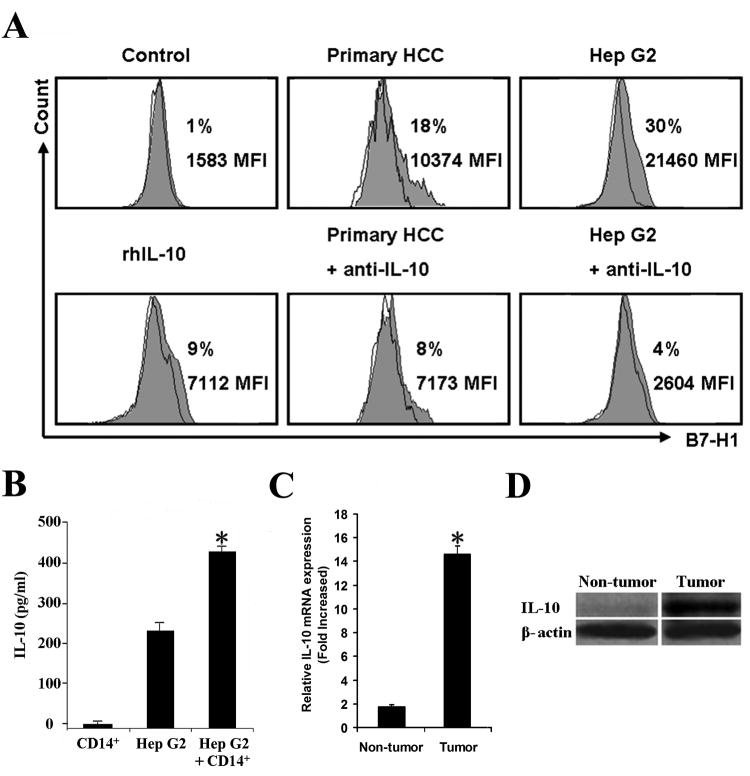
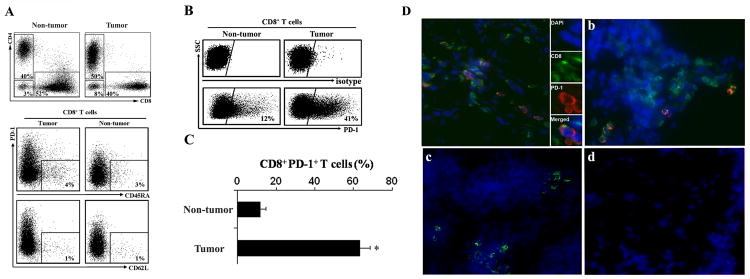
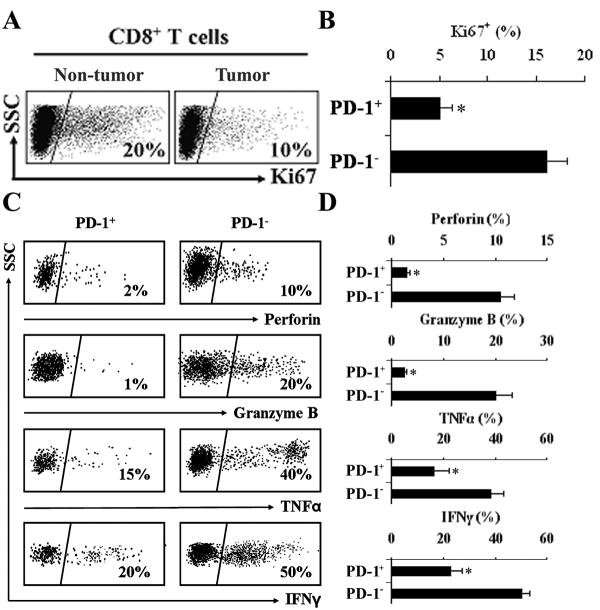
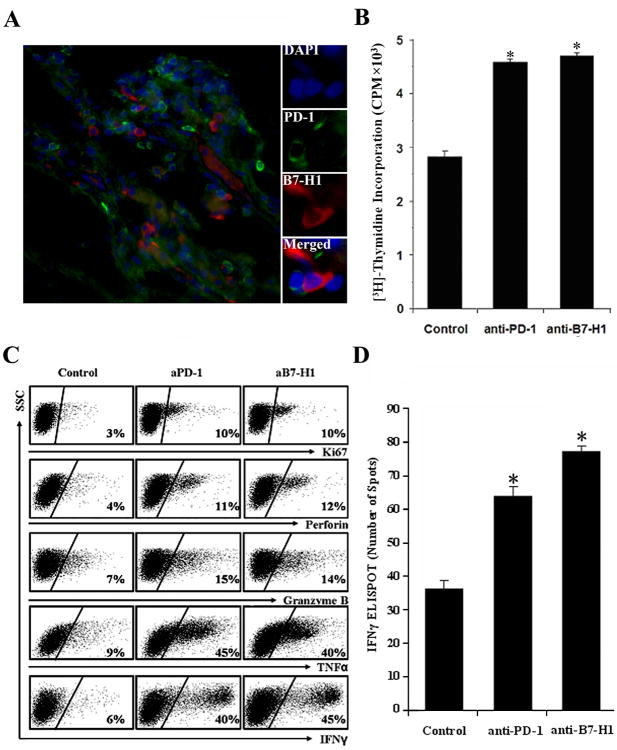
B7-H1 is a recently identified B7 family member that, along with one of its receptors, programmed death-1 (PD-1), has been involved in multiple immunopathologic scenarios. However, the nature of B7-H1 and PD-1 in human hepatocellular carcinoma (HCC) remains poorly defined. We investigated the expression and functional relevance of this pathway in patients with HCC. We showed that B7-H1 expression on Kupffer cells (KC) was increased in tumor tissues compared with surrounding nontumor liver tissues in patients with HCC and this correlated with poorer survival. Coculture of HCC cells with monocytes showed that tumor-associated interleukin-10 contributed to the induction of B7-H1 in the HCC environment. We further observed that the levels of PD-1(+)CD8(+) T cells were higher in tumor tissues than in nontumor tissues. B7-H1(+) KCs and PD-1(+) T cells were colocalized in the HCC stroma. PD-1(+)CD8(+) T cells had decreased proliferative ability and effector function as shown by reduced granule and cytokine expression compared with PD-1(-) T cells. Importantly, blocking KC B7-H1 interaction with PD-1(+)CD8(+) cells using neutralizing antibodies recovered effector T-cell function. Our data indicate that the B7-H1/PD-1 axis contributes to immune suppression in human HCC, with blockade of this pathway carrying important therapeutic implications.


Figures

Figure 1
Figure 1
KCs express increased B7-H1 in human HCC. APC subsets in human HCC were analyzed by FACS. A, CD45+ leukocytes were analyzed and gated on Lin-HLA-DR+ cells. Representative dot plots of KCs (HLA-DR+CD14+), pDCs (lin-HLA-DR+CD4+CD11c-CD123+), and mDCs (lin-HLA-DR+ CD4+CD11c+CD123-) from both tumor tissues or non-tumor tissues. B, Representative FACS histogram of B7-H1+ KCs. Filled histogram, B7-H1 expression; open histogram, antibody isotype control. MFI, Mean fluorescence intensity. C, B7-H1+KCs in HCC tumor tissue (a), surrounding non-tumor tissue (b) and normal liver tissue (c). The immunohistochemistry showed B7-H1 (red) staining was found on CD68+ KCs (green) in HCC tumor tissue. Nuclear was stained by DAPI (blue). Mouse IgG1 and IgG2b were used as isotype controls (d) for B7-H1 and CD68 staining, respectively. Representative sections are shown from 8 patients. ×400 magnification. D, Kaplan-Meier survival curves of HCC patients as determined by B7-H1 expression on IHC of tumor tissue black line, low expression (n = 36); red line, high expression (n = 35). p = 0.014.
Figure 2
Figure 2
HCC microenviromental factors induce monocyte B7-H1 expression. CD14+ monocytes from healthy donor blood were sorted and co-cultured with primary HCC tumor cells or Hep G2 cells in a transwell system for 48 h. B7-H1 expression on monocytes was determined by FACS. A, CD14+ monocytes co-cultured with primary HCC tumor cells or Hep G2 cells expressed more B7-H1 than CD14+ cells alone (control). B7-H1 expression increased moderately on monocytes alone with recombinant human IL-10 (10ng/ml). Co-culture treatment with anti-IL-10 neutralizing antibody inhibited B7-H1 expression. Data are representative of 5 independent experiments for Hep G2 and triplicate cultures for primary HCC. Filled histogram, B7-H1 expression; open histogram, antibody isotype control. MFI, Mean fluorescence intensity. B, Supernatants were collected from transwells and IL-10 was detected by ELISA. Results were shown as the mean ± SEM. *, P <0.05 vs. CD14+ monocytes alone or Hep G2 cells alone. n=5 experiments. C, representative Western blot for IL-10 protein in HCC vs. non-tumor liver tissue, n = 8 patients D, real-time RT-PCR for IL-10 expression *, P < 0.05. n= 8 patients.
Figure 3
Figure 3
HCC tumor associated CD8+ T cells highly express PD-1. Human HCC T cell subsets were analyzed by FACS. A, Top, representative dot plots of CD4+ and CD8+ T cells from 20 HCC patients gated on CD3+ cells. The proportions of CD4+ and CD8+ T cells in both tumor tissue and non-tumor tissue. Bottom, representative phenotype dot plots of CD8+ T cells showed both in HCC tumor and non-tumor tissues less than 5% CD8+ T cells are CD45RA+ or CD62L+. n= 8 patients. B, Representative dot plots of PD-1+CD8+ T cells from 20 HCC patients in tumor and non-tumor tissue. Top, isotype control. Bottom, PD-1 expression on CD8+ cells. C, The mean percentage of PD-1+CD8+ T cells in tumor tissues and non-tumor tissues. *, P < 0.05. n= 20 patients. D, PD-1+CD8+ T cells in HCC tumor tissue (a), surrounding non-tumor tissue (b) and normal liver tissue (c). PD-1 (red) staining was largely limited to CD8 cells (green). Mouse IgG1 and rat IgG were used as antibody isotype controls (d) for PD-1 and CD8 staining, respectively. DAPI nuclear (blue), ×400 magnification, n = 8 patients.
Figure 4
Figure 4
Decreased effector function of PD-1+CD8+ T cells in human HCC. A, Representative dot plots of Ki67 expression in CD8+ T cells from tumor tissues vs. non-tumor tissue are shown and B, Ki67 expressed as mean percentage cells in PD-1+CD8+ or PD-1-CD8+ T cells in human HCC tissues. *, P < 0.05. n = 20 patients. C, PD-1+CD8+ T cells in HCC tumor tissues demonstrated decreased effector function compared to PD1- T cells. Representative dot plots showing the percentage of perforin, granzyme B, TNFα and IFNγ expressing cells in PD-1+ vs. PD-1- CD8+ T cells and D, the mean percentages of perforin, granzyme B, TNFα, and IFNγ in PD-1+CD8+ T cells in HCC tumor tissues vs. PD1- T cells. *, P < 0.05. n = 20 patients.
Figure 5
Figure 5
B7-H1+ and PD-1+ cells were co-localized in HCC and mediated T cell immune suppression. A, PD-1+ cells (green) were co-localized with B7-H1+ cells (red), DAPI nuclear (blue), and ×400 magnification. Representative data for 8 patients. B, C, Blocking B7-H1 or PD-1 increased T cell effector function. CD14+ and CD8+ cells were sorted from human HCC and co-cultured for 5 days with anti-CD3 and anti-CD28 antibodies. Where indicated, anti-PD-1 or anti-B7-H1 monoclonal antibodies were added and compared to control (mouse anti-human IgG1 isotype control for both anti-PD-1 and anti-B7-H1 antibodies). B, CD8+ T cells proliferation was determined by 3[H]-thymidine incorporation and expressed as the mean CPM ± SEM and are representative of n = 5 experiments. *, p<0.05 vs. isotype control. C, Expression of Ki67, perforin, granzyme B and cytokines was determined by FACS analysis with representative dot plots shown from 5 experiments. D. HCC-specific CD8+ T cell response. CD8+ T cells were stimulated with KCs loaded with autologous HCC lysates over 5 days and HCC-specific IFNγ was determined by ELISPOT in the presence or absence of anti-B7-H1 or anti-PD-1 antibody. Results were shown as the mean number of IFNγ spots per 105 CD8+ T cells ± SEM. *, p<0.05 vs. isotype control. n = 3 experiments.

Similar articles

Cited by

References

    1. El-Serag HB, Marrero JA, Rudolph L, et al. Diagnosis and treatment of hepatocellular carcinoma. Gastroenterology. 2008;134:1752–63. - PubMed
    1. Zou W. Immunosuppressive networks in the tumour environment and their therapeutic relevance. Nat Rev Cancer. 2005;5:263–74. - PubMed
    1. Gao Q, Qiu SJ, Fan J, et al. Intratumoral balance of regulatory and cytotoxic T cells is associated with prognosis of hepatocellular carcinoma after resection. J Clin Oncol. 2007;25:2586–93. - PubMed
    1. Ossendorp F, Mengedé E, Camps M, et al. Specific T helper cell requirement for optimal induction of cytotoxic T lymphocytes against major histocompatibility complex class II negative tumors. J Exp Med. 1998;187(5):693–702. - PMC - PubMed
    1. Gajewski TF, Meng Y, Blank C, et al. Immune resistance orchestrated by the tumor microenvironment. Immunol Rev. 2006;213:131–45. - PubMed

Publication types

MeSH terms