. 2009 Dec;19(12):2308-16.
doi: 10.1101/gr.097097.109. Epub 2009 Oct 13.

Simultaneous assay of every Salmonella Typhi gene using one million transposon mutants

Affiliations

Simultaneous assay of every Salmonella Typhi gene using one million transposon mutants

Gemma C Langridge et al. Genome Res. 2009 Dec.

Abstract

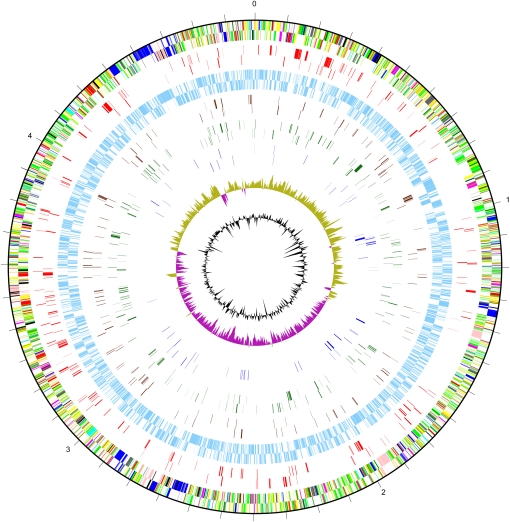
Very high-throughput sequencing technologies need to be matched by high-throughput functional studies if we are to make full use of the current explosion in genome sequences. We have generated a very large bacterial mutant pool, consisting of an estimated 1.1 million transposon mutants and we have used genomic DNA from this mutant pool, and Illumina nucleotide sequencing to prime from the transposon and sequence into the adjacent target DNA. With this method, which we have called TraDIS (transposon directed insertion-site sequencing), we have been able to map 370,000 unique transposon insertion sites to the Salmonella enterica serovar Typhi chromosome. The unprecedented density and resolution of mapped insertion sites, an average of one every 13 base pairs, has allowed us to assay simultaneously every gene in the genome for essentiality and generate a genome-wide list of candidate essential genes. In addition, the semiquantitative nature of the assay allowed us to identify genes that are advantageous and those that are disadvantageous for growth under standard laboratory conditions. Comparison of the mutant pool following growth in the presence or absence of ox bile enabled every gene to be assayed for its contribution toward bile tolerance, a trait required of any enteric bacterium and for carriage of S. Typhi in the gall bladder. This screen validated our hypothesis that we can simultaneously assay every gene in the genome to identify niche-specific essential genes.


Figures

Figure 1.
Figure 1.
Essential genes in S. Typhi. (A) Frequency and distribution of transposon directed insertion-site sequence reads across the entire S. Typhi Ty2 genome for a pool of one million transposon mutants. The y-axis shows the number of mapped sequence reads within a window size of 3. ori and ter indicate the approximate positions of the replication origin and terminus, respectively. (B) Bimodal frequency distribution of insertion index (number of inserts per gene divided by gene length). Genes with insertion indices in the leftmost peak represent those that have none, or very few insertions (essential genes). (C–E) Detailed plots generated using Artemis (Rutherford et al. 2000) showing distribution of sequence reads across selected regions of the S. Typhi Ty2 genome. The y-axis shows the number of mapped sequence reads within a window size of three. The maximum number of sequence reads within each plot is shown (top right) and the position of annotated genes relative to the plotted sequence reads is indicated below the distribution plot; gray boxes represent genes, and white boxes pseudogenes. (C) The essential plsC gene and topoisomerase IV genes, parC and parE, showing the absence of transposon insertions. (D) Sequence reads mapping to regions between essential genes and the fabZ lpxA lpxB rnhB dnaE accA operon disrupted by insertions into rnhB (E) show that the Tn5-derived transposon is capable of generating many nonpolar mutations.
Figure 2.
Figure 2.
Genetic map showing results of simultaneous assay of the whole S. Typhi Ty2 genome. The outer scale is marked in megabases. Circles range from 1 (outer circle) to 8 (inner circle) and represent genes on both forward and reverse strands. Circle 1, all genes (color-coded according to function: dark blue, pathogenicity/adaptation; black, energy metabolism; red, information transfer; dark green, membranes/surface structures; cyan, degradation of macromolecules; purple, degradation of small molecules; yellow, central/intermediary metabolism; light blue, regulators; pink, phage/IS elements; orange, conserved hypothetical; pale green, unknown function; brown, pseudogenes); circle 2, essential genes (red); circle 3, nonessential genes (light blue); circle 4, genes involved in bile tolerance (brown); circle 5, genes advantageous for growth over six passages (dark green); circle 6, genes disadvantageous for growth over six passages (dark blue); circle 7, GC bias [(G – C)/(G + C)]; khaki indicates values > 1; purple < 1; circle 8, %(G + C) content.
Figure 3.
Figure 3.
Changes in composition of the mutant pool with passaging. (A) Frequency and distribution of transposon directed insertion-site sequence reads across the entire Ty2 genome in the original 1 million mutant pool (top) and following growth in broth of the pool through one, three, and six passages. The plot has a window size of 3. (B) Frequency and distribution of sequence reads across the flagella (fli) operon at passage 6 compared to the original mutant pool (passage 0) showing an increase in the number of flagella gene mutants following growth. (C) With genes divided into functional classes based on the S. Typhi CT18 annotation, the observed number of different transposon insertion sites per functional gene class is expressed as a proportion of the insertion sites expected if sites were distributed randomly for passages 0 and 6. Values greater than 1 indicate that insertions into the gene class are better tolerated, while values less than 1 indicate that insertions into the gene class are more poorly tolerated. (D) Passage 0 value minus Passage 6 value from C plotted to emphasize how much the proportion of expected differs between these passages. Larger values indicate a more important role during growth in broth for the gene class than smaller or negative values. Path./adapt./chap., pathogenicity, adaptation, chaperones; Mem./surface structures, membrane/surface structures; Deg., degradation; Cen./int. metabolism, central/intermediary metabolism; Cons. hypothetical, conserved hypothetical.
Figure 4.
Figure 4.
Bile tolerance. (A) With genes divided into functional classes based on the S. Typhi CT18 annotation, the observed number of different transposon insertion sites per functional gene class is expressed as a proportion of the insertion sites expected if sites were distributed randomly for growth in the presence or absence of bile (abbreviations as in Fig. 3). Values greater than 1 indicate that insertions into the gene class are better tolerated, while values less than 1 indicate that insertions into the gene class are more poorly tolerated. (B) Data from A plotted to show how much the proportion of expected differs between LB (no bile) and bile (LB supplemented with 10% ox bile). A positive value indicates more insertions than expected in LB relative to bile; a negative value indicates fewer insertions than expected in LB relative to bile. (C) Detailed plot generated using Artemis (Rutherford et al. 2000), comparing the frequency and distribution of transposon directed insertion site sequence reads across the O-antigen biosynthesis (wba) genes following growth in the absence (top distribution) or presence (bottom distribution) of ox bile. The y-axis shows the number of mapped sequence reads within a window size of 3. The maximum number of sequence reads within each plot is shown top right. After growth in the presence of ox bile the number of transposon insertions is much reduced in this region. (D) Similar to (C), showing the frequency and distribution of sequence reads in and adjacent to the pagP gene.

Similar articles

Cited by

References

    1. Andrews-Polymenis HL, Santiviago CA, McClelland M. Novel genetic tools for studying food-borne Salmonella. Curr Opin Biotechnol. 2009;20:149–157. - PMC - PubMed
    1. Baba T, Ara T, Hasegawa M, Takai Y, Okumura Y, Baba M, Datsenko KA, Tomita M, Wanner BL, Mori H. Construction of Escherichia coli K-12 in-frame, single-gene knockout mutants: The Keio collection. Mol Sys Biol. 2006;2:2006.0008. - PMC - PubMed
    1. Bentley DR, Balasubramanian S, Swerdlow HP, Smith GP, Milton J, Brown CG, Hall KP, Evers DJ, Barnes CL, Bignell HR. Accurate whole human genome sequencing using reversible terminator chemistry. Nature. 2008;456:53–59. - PMC - PubMed
    1. Caygill CP, Braddick M, Hill MJ, Knowles RL, Sharp JC. The association between typhoid carriage, typhoid infection and subsequent cancer at a number of sites. Eur J Cancer Prev. 1995;4:187–193. - PubMed
    1. Charles IG, Maskell DJ. Transposon mediated differential hybridisation. 2001 Patent no. WO2001/007651.

Publication types

MeSH terms

Substances