. 2009 Oct 27;106(43):18357-61.
doi: 10.1073/pnas.0902573106. Epub 2009 Oct 13.

A wave of nascent transcription on activated human genes

Affiliations

A wave of nascent transcription on activated human genes

Youichiro Wada et al. Proc Natl Acad Sci U S A. .

Abstract

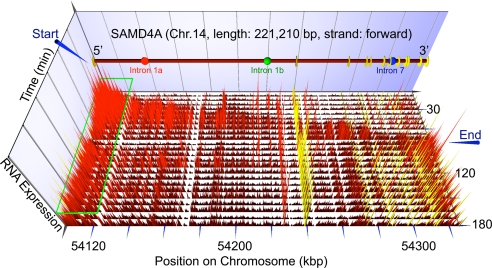
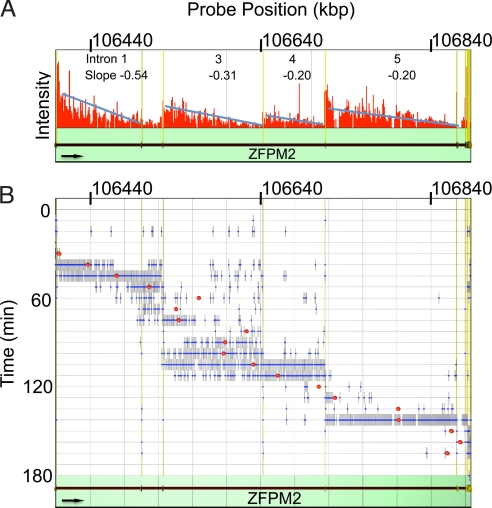
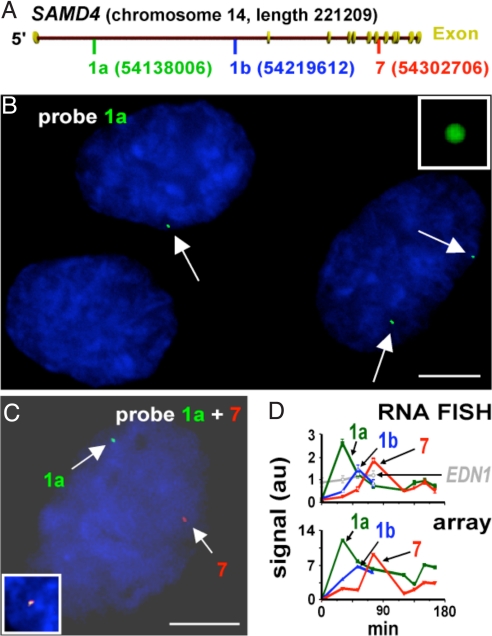
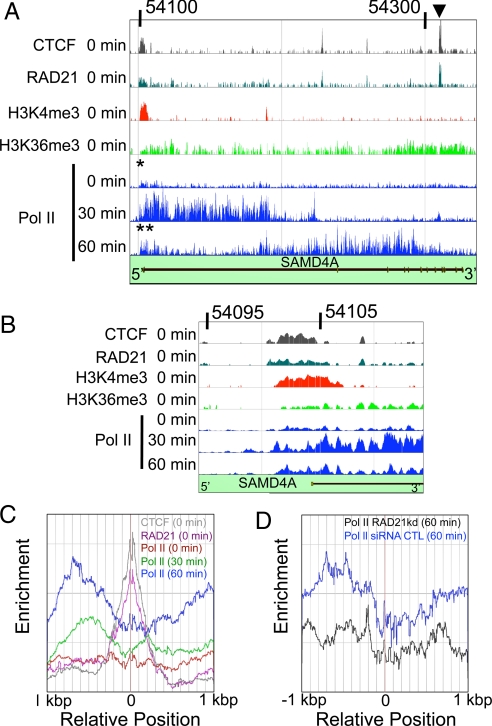
Genome-wide studies reveal that transcription by RNA polymerase II (Pol II) is dynamically regulated. To obtain a comprehensive view of a single transcription cycle, we switched on transcription of five long human genes (>100 kbp) with tumor necrosis factor-alpha (TNFalpha) and monitored (using microarrays, RNA fluorescence in situ hybridization, and chromatin immunoprecipitation) the appearance of nascent RNA, changes in binding of Pol II and two insulators (the cohesin subunit RAD21 and the CCCTC-binding factor CTCF), and modifications of histone H3. Activation triggers a wave of transcription that sweeps along the genes at approximately 3.1 kbp/min; splicing occurs cotranscriptionally, a major checkpoint acts several kilobases downstream of the transcription start site to regulate polymerase transit, and Pol II tends to stall at cohesin/CTCF binding sites.


Conflict of interest statement

The authors declare no conflict of interest.

Figures

Fig. 1.
Fig. 1.
Transcription waves visualized using microarrays. HUVECs were stimulated with TNFα, samples collected every 7.5 min for 3 h, and total nuclear RNA purified and hybridized to a tiling microarray bearing 25-mers complementary to SAMD4A. The vertical axis gives intensity of signal detected by intronic and exonic probes (marked by red and yellow needles, respectively). Gene length and genomic location are shown at the front, probe positions within the gene from left to right; and time after stimulation from top to bottom. Blue arrowheads indicate the “Start” and “End” of the first wave of transcription that sweeps down the gene; green rectangle marks the position of probes continuously yielding signal between 7.5–180 min. Intronic targets for RNA FISH probes (1a, red; 1b, green; 7, blue) are indicated on the gene map.
Fig. 2.
Fig. 2.
Speed of the transcription wave on ZFPM2. (A) Decay of RNA. Sum total signals given by all probes in 1,000 base windows between 15 and 180 min was calculated and shown by red bars (height reflects intensity). Blue lines were obtained by linear regression (slope indicated in each intron), showing that signal declines to zero from beginning to end of each intron. (B) Speed of wave front. For each probe on the tiling array, a blue dot indicates where expression first reaches 50% of the maximum (using 40–70% of the maximum yields similar velocities; Fig. S3), and we use this to define the wave front. A red dot marks the average position of all blue dots at one time point. The velocity of the wave front was calculated by linear regression using the red dots (red line). Vertical axis shows time after stimulation. Genomic location is shown on top of each column. Direction of the gene is shown by the arrow.
Fig. 3.
Fig. 3.
A transcription wave visualized by RNA FISH. HUVECs were fixed at 0, 30, 52.5 and 75 min after stimulation with TNFα, and nascent SAMD4A or EDN1 RNA were detected by FISH using intron probes 1a, 1b, or 7, or an intron probe against EDN1 (labeled with Alexa 488), cells counterstained with DAPI, and images were collected. SAMD4 intron 1a (green), 1b (red), and 7 (blue) peaked as a wave of transcription passed through each region with time, whereas EDN1 signal (gray) remains constant (D, upper graph). Similar variations were given by relevant probes in microarrays (D, lower graph). (A) SAMD4A locus showing probe positions. (B) A typical field 30 min after stimulation obtained using probe 1a. Cells have 0, 1, or 2 green foci/cell (arrows) marking nascent RNA at one or other allele. Intensities are normalized relative to fluorescent beads (inset) to permit comparison between different experiments. Bar, 5 μm. (C) A nucleus 150 min after stimulation using probes 1a and 7; it contains one red and one green focus marking nascent RNA from each intron; yellow foci are never seen. (Inset) Positive control showing yellow focus given by probes 1a (green) and 1a-1 (red) 30 min after induction; these probes target intronic RNA sequences lying 1,000 nucleotides apart. Bar, 5 μm. (D) RNA FISH and arrays give similar results. (Top) Signals (i.e., size in pixels × intensity × number of foci; in arbitrary units [au]) were obtained by single (open symbols; as in B) or double labeling (closed symbols, as in C). (Bottom) Similar variations are given by relevant probes in arrays.
Fig. 4.
Fig. 4.
Stalling of Pol II analyzed using chromatin immunoprecipitation. HUVECs were stimulated with TNFα and harvested after 0, 30, and 60 min; then binding of CTCF, RAD21, modified histones (H3K4me3, H3K36me3), and elongating Pol II (phospho-Ser-5 modification) to SAMD4A was analyzed by ChIP-chip (CTCF, RAD21, H3K4me3, H3K36me3, and Pol II). Numbers on top of A and B show the location of the genomic region of Chr14 (SAMD4A) analyzed. (Vertical axes) Enrichment of binding. (A) Binding to SAMD4A. CTCF and RAD21 are often found together, consistent with the binding of a functional insulator complex. Asterisk shows where (engaged) Pol II binds at 0 min near the TSS, suggesting that it might be paused or poised. Double asterisk shows where Pol II binds near the TSS at 60 min. Arrowhead shows representative colocalization site of RAD21 and CTCF ≈210 kilonucleotides downstream of the TSS. (B) Binding at the TSS of SAMD4A. H3K4me3 and CTCF/RAD21 bind in/around the TSS. At 0 min, engaged Pol II also binds to this region. At 30 min, Pol II binding spreads into the gene, and after 60 min it becomes more concentrated around the TSS again. (C) Enrichments (number densities) of engaged Pol II near 35 sites distant from the TSS that were marked by bound RAD21 (pink) and CTCF (gray). At 0 min (red line), Pol II binds symmetrically around the RAD21/CTCF. At 30 min (green line), the amount of Pol II binding increases significantly. At 60 min (blue line), Pol II binding increases further and becomes concentrated upstream of the RAD21/CTCF; this is consistent with polymerase stalling. (D) An 80% reduction in RAD21 levels (achieved using siRNA) at 60 min (black) destroys the accumulation 5′ of the RAD21/CTCF site that is seen with a control siRNA (blue).

References

    1. Kornberg RD. The molecular basis of eukaryotic transcription. Proc Natl Acad Sci USA. 2007;104:12955–12961. - PMC - PubMed
    1. Maniatis T, Reed R. An extensive network of coupling among gene expression machines. Nature. 2002;416:499–506. - PubMed
    1. Orphanides G, Reinberg D. A unified theory of gene expression. Cell. 2002;108:439–451. - PubMed
    1. Phatnani HP, Greenleaf AL. Phosphorylation and functions of the RNA polymerase II CTD. Genes Dev. 2006;20:2922–2936. - PubMed
    1. Kapranov P, Cawley SE, Drenkow J, Bekiranov S, Strausberg RL, et al. Large-scale transcriptional activity in chromosomes 21 and 22. Science. 2002;296:916–919. - PubMed

Publication types

MeSH terms

Associated data