. 2009 Oct 27;106(43):18267-72.
doi: 10.1073/pnas.0907518106. Epub 2009 Oct 13.

Fibronectin forms the most extensible biological fibers displaying switchable force-exposed cryptic binding sites

Affiliations

Fibronectin forms the most extensible biological fibers displaying switchable force-exposed cryptic binding sites

Enrico Klotzsch et al. Proc Natl Acad Sci U S A. .

Abstract

Rather than maximizing toughness, as needed for silk and muscle titin fibers to withstand external impact, the much softer extracellular matrix fibers made from fibronectin (Fn) can be stretched by cell generated forces and display extraordinary extensibility. We show that Fn fibers can be extended more than 8-fold (>700% strain) before 50% of the fibers break. The Young's modulus of single fibers, given by the highly nonlinear slope of the stress-strain curve, changes orders of magnitude, up to MPa. Although many other materials plastically deform before they rupture, evidence is provided that the reversible breakage of force-bearing backbone hydrogen bonds enables the large strain. When tension is released, the nano-sized Fn domains first contract in the crowded environment of fibers within seconds into random coil conformations (molten globule states), before the force-bearing hydrogen bond networks that stabilize the domain's secondary structures are reestablished within minutes (double exponential). The exposure of cryptic binding sites on Fn type III modules increases steeply upon stretching. Thus fiber extension steadily up-regulates fiber rigidity and cryptic epitope exposure, both of which are known to differentially alter cell behavior. Finally, since stress-strain relationships cannot directly be measured in native extracellular matrix (ECM), the stress-strain curves were correlated with stretch-induced alterations of intramolecular fluorescence resonance energy transfer (FRET) obtained from trace amounts of Fn probes (mechanical strain sensors) that can be incorporated into native ECM. Physiological implications of the extraordinary extensibility of Fn fibers and contraction kinetics are discussed.


Conflict of interest statement

The authors declare no conflict of interest.

Figures
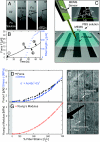
Fig. 1.
Fig. 1.
Force probe and the mechanical characterization of Fn fibers. (A) After contacting the tip of a MEMS force sensor (37) with a droplet of highly concentrated Fn solution, the MEMS sensor was pulled back with a constant speed of 8 μm/s. (B) Sequential confocal images (10× air objective) provided fiber contour lengths (blue), while the force F along the fiber was simultaneously probed (red). (C) The lateral force sensor was prepared by gluing a sharp tungsten probe to the sensing arm of the lever. The fibers were deposited across the trenches of a microfabricated PDMS sheet, rehydrated and then mechanically stretched in PBS at room temperature by the MEMS force sensor. (D) The calculated force F versus strain ϵ curve along the fiber is given for a single, 3.0 μm diameter Fn fiber traversing a 30 μm wide trench (see inset in panel B and SI Text). The extension was measured from optical images (E and F), and the absolute strain was calculated according to the procedure outlined in Fig. 2. The stress in panel D was calculated from the initial diameter assuming a constant volume of the fiber throughout the measurement and fit to a third-order polynomial (blue solid line, see also Fig. S2). (G) The Young's modulus is given by the slope of the stress-strain curve as fitted by the parameters A = 6.9e−3, B = 9.4e−5, and C = 2.3e−6 in panel D. Data sets for six more fibers are given in Fig. S3.
Fig. 2.
Fig. 2.
Fn fiber extensibility, module unfolding, and fiber breakage. (A) Fn fibers were manually deposited across trenches on elastic microfabricated PDMS sheets after activating the PDMS surfaces with aminosilane and glutaraldehyde to prevent fiber slippage. The PDMS sheets were then mounted in a strain device (18, 19). (B and C) Confocal microscope images of fluorescent Fn fibers overlaid on top of bright-field images showed that the Fn fibers were freely suspended across the trenches. (B) To identify the point at which the Fn fibers were fully relaxed (0% strain), the fibers were deposited across trenches that were prestretched and then relaxed until the fibers began to sag. (C) To determine the extension at fiber breakage, the fibers were deposited on unstrained PDMS sheets and then stretched. At 2.6-fold relative extension, two suspended fibers were still intact (arrows), while the other two sections of the fiber were broken (arrowheads). The red circles indicate photobleached notches before and after strain application indicating that no relative slippage of Fn within the fiber occurs (see also Fig. S1). (D) The percentage of straight (not sagged) and intact (not ruptured) fibers was quantified for n = 35 fibers in six fields of view upon relaxation, and for n = 296 fibers in 18 fields of view upon extension, respectively. The relative strain at which 50% of the fibers were fully relaxed was used to calculate the absolute percent fiber strain. (E) As probed by intramolecular FRET (15, 19), the IA/ID ratio probed at 100% fiber strain correlates well with that obtained for partially denatured Fn in solution (see Fig. S5) at the point where the first loss of secondary structure sets in at a denaturant concentration of 1 M guanidinium HCl (GdnHCl) for monomeric Fn (19). The integrated values of the IA/ID histogram of those pixels that have an IA/ID ratio smaller than the peak value probed at 1 M GdnHCl, corresponding to approximately 100% strain, are shown here for six fibers, and is referred to as fraction of Fn with perturbed secondary structure. (F) To quantify the force-induced exposure of buried cysteines in FnIII7 and FnIII15, freely suspended fibers were stretched, after incubation with 2% BSA for 15 min to prevent unspecific binding, and allowed to react with free Alexa 488 maleimide in solution (four fibers, seven fields of view). The filled gray squares indicate amount of nonspecifically bound Alexa 488 to Fn fibers where the cysteines were alkylated (see SI Text).
Fig. 3.
Fig. 3.
Length recovery kinetics of Fn fibers. (A–D) A relaxed Fn fiber was strained 259%, and the contraction was imaged after releasing the fiber from the MEMS sensor tip (B–D). (E) Optical contour length measurements quantified the time-dependent percent fiber strain as shown for three individual fibers (each color is a single fiber). The lettered red arrows correspond to subfigures (A–D). The kinetics of recovery of the original length could be fitted well by a double exponential curve with half lifetimes of τ1 (fast recovery) and τ2 (slow recovery), whereby the decay amplitude A1 is the externally adjusted strain (time 0) and A2 was used as a fit parameter.
Fig. 4.
Fig. 4.
Recovery of the mechanical properties of Fn fibers between two subsequent pulls. (A and B) Four different Fn fibers were first stretched with the MEMS force sensor, allowed to recover for the specified waiting times [less than 1 min (open symbols) and more than 1 min (filled symbols)] and stretched again in the low strain (black-green) and high strain (black-red) regions, starting from relaxed or 140% prestrained fibers, respectively. (C) The force versus time curves are given for the experiments shown in panels A and B. (D) To quantify the kinetics of mechanical recovery of the fibers, the integrated area under the force-extension curves was calculated for the first, E1, and second pulls, E2. (D) The integrated area of the second pull E2 divided by the area under the first pull E1 is given as a function of waiting time for 10 different fibers. The curves were fit to an exponential curve with τ′ = 58 ± 8 s (green line) and τ″ = 38 ± 6 s (red line) for the low and high strain regimes, respectively.

Similar articles

Cited by

References

    1. Guthold M, et al. A comparison of the mechanical and structural properties of fibrin fibers with other protein fibers. Cell Biochem Biophys. 2007;49:165–181. - PMC - PubMed
    1. Gosline JM, Guerette PA, Ortlepp CS, Savage KN. The mechanical design of spider silks: From fibroin sequence to mechanical function. J Exp Biol. 1999;202:3295–3303. - PubMed
    1. Liu W, et al. Fibrin fibers have extraordinary extensibility and elasticity. Science. 2006;313:634. - PMC - PubMed
    1. Collet JP, Shuman H, Ledger RE, Lee S, Weisel JW. The elasticity of an individual fibrin fiber in a clot. Proc Natl Acad Sci USA. 2005;102:9133–9137. - PMC - PubMed
    1. Lu H, Isralewitz B, Krammer A, Vogel V, Schulten K. Unfolding of titin immunoglobulin domains by steered molecular dynamics simulation. Biophys J. 1998;75:662–671. - PMC - PubMed

Publication types

LinkOut - more resources