

Long-term Fenretinide treatment prevents high-fat diet-induced obesity, insulin resistance, and hepatic steatosis
- PMID: 19826103
- PMCID: PMC2793052
- DOI: 10.1152/ajpendo.00362.2009
Long-term Fenretinide treatment prevents high-fat diet-induced obesity, insulin resistance, and hepatic steatosis
Abstract
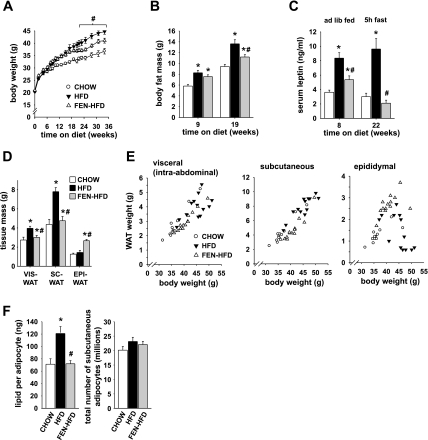
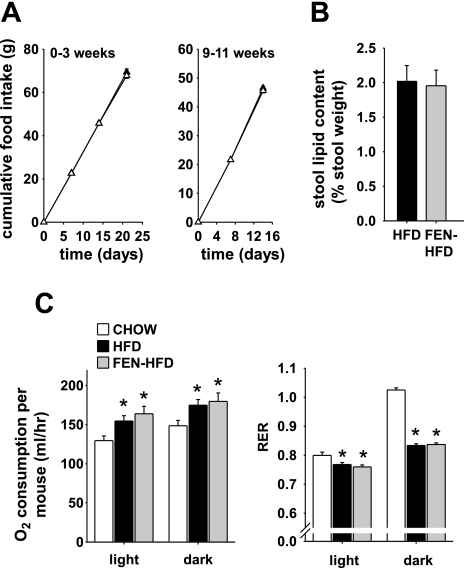
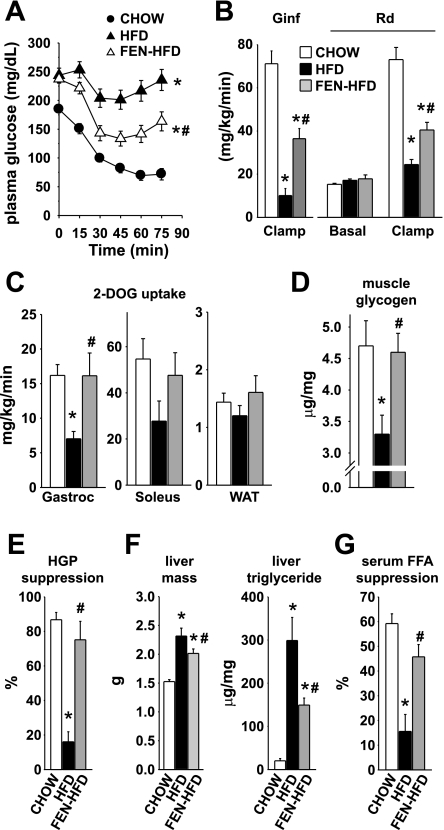
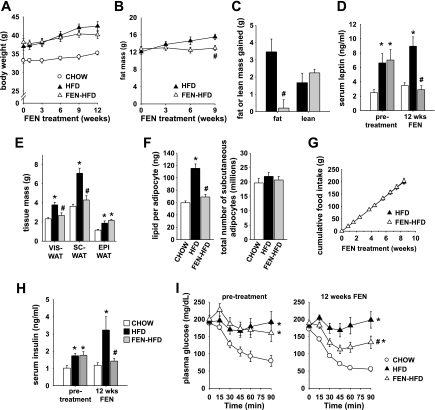
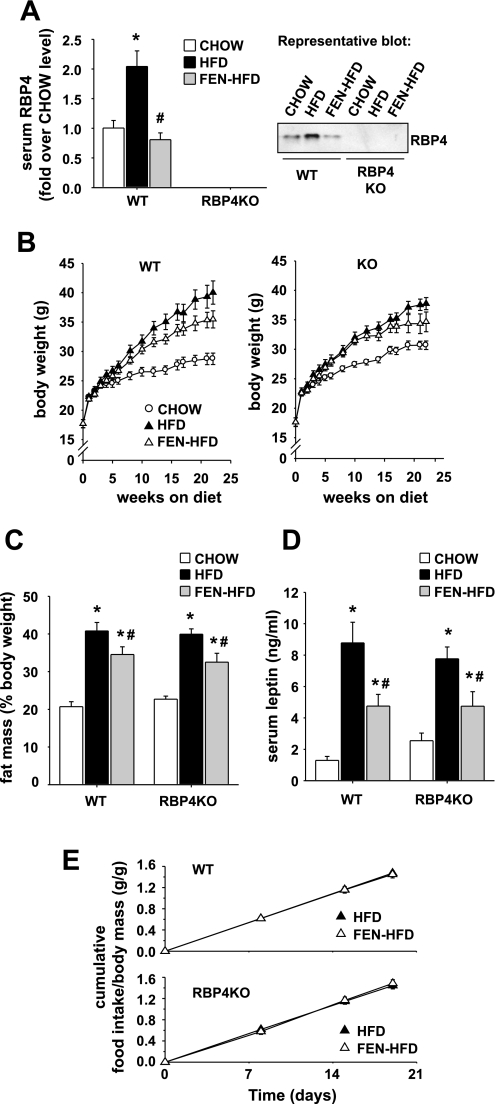
The synthetic retinoid Fenretinide (FEN) increases insulin sensitivity in obese rodents and is in early clinical trials for treatment of insulin resistance in obese humans with hepatic steatosis (46). We aimed to determine the physiological mechanisms for the insulin-sensitizing effects of FEN. Wild-type mice were fed a high-fat diet (HFD) with or without FEN from 4-5 wk to 36-37 wk of age (preventive study) or following 22 wk of HF diet-induced obesity (12 wk intervention study). Retinol-binding protein-4 (RBP4) knockout mice were also fed the HFD with or without FEN in a preventive study. FEN had minimal effects on HFD-induced body weight gain but markedly reduced HFD-induced adiposity and hyperleptinemia in both studies. FEN-HFD mice gained epididymal fat but not subcutaneous or visceral fat mass in contrast to HFD mice without FEN. FEN did not have a measurable effect on energy expenditure, food intake, physical activity, or stool lipid content. Glucose infusion rate during hyperinsulinemic-euglycemic clamp was reduced 86% in HFD mice compared with controls and was improved 3.6-fold in FEN-HFD compared with HFD mice. FEN improved insulin action on glucose uptake and glycogen levels in muscle, insulin-stimulated suppression of hepatic glucose production, and suppression of serum FFA levels in HFD mice. Remarkably, FEN also reduced hepatic steatosis. In RBP4 knockout mice, FEN reduced the HFD-induced increase in adiposity and hyperleptinemia. In conclusion, long-term therapy with FEN partially prevents or reverses obesity, insulin resistance, and hepatic steatosis in mice on HFD. The anti-adiposity effects are independent of the RBP4 lowering effect.
Figures
Similar articles
-
Fenretinide ameliorates insulin resistance and fatty liver in obese mice.Biol Pharm Bull. 2012;35(3):369-75. doi: 10.1248/bpb.35.369. Biol Pharm Bull. 2012. PMID: 22382323
-
Fenretinide treatment prevents diet-induced obesity in association with major alterations in retinoid homeostatic gene expression in adipose, liver, and hypothalamus.Diabetes. 2013 Mar;62(3):825-36. doi: 10.2337/db12-0458. Epub 2012 Nov 27. Diabetes. 2013. PMID: 23193184 Free PMC article.
-
Liver-specific Prkn knockout mice are more susceptible to diet-induced hepatic steatosis and insulin resistance.Mol Metab. 2020 Nov;41:101051. doi: 10.1016/j.molmet.2020.101051. Epub 2020 Jul 10. Mol Metab. 2020. PMID: 32653576 Free PMC article.
-
The mechanisms of Fenretinide-mediated anti-cancer activity and prevention of obesity and type-2 diabetes.Biochem Pharmacol. 2014 Oct 1;91(3):277-86. doi: 10.1016/j.bcp.2014.07.012. Epub 2014 Jul 25. Biochem Pharmacol. 2014. PMID: 25069047 Review.
-
Impact of Short-Term Lipid Overload on Whole-Body Physiology.Mol Cell Biol. 2025;45(2):47-58. doi: 10.1080/10985549.2024.2438814. Epub 2024 Dec 27. Mol Cell Biol. 2025. PMID: 39726368 Review.
Cited by
-
Remodeling adipose tissue inflammasome for type 2 diabetes mellitus treatment: Current perspective and translational strategies.Bioeng Transl Med. 2019 Dec 13;5(2):e10150. doi: 10.1002/btm2.10150. eCollection 2020 May. Bioeng Transl Med. 2019. PMID: 32440558 Free PMC article. Review.
-
A New Strategy for Obesity Treatment: Revealing the Frontiers of Anti-obesity Medications.Curr Mol Med. 2025;25(1):13-26. doi: 10.2174/0115665240270426231123155924. Curr Mol Med. 2025. PMID: 38289639 Review.
-
Transcriptome profiling and genome-wide DNA binding define the differential role of fenretinide and all-trans RA in regulating the death and survival of human hepatocellular carcinoma Huh7 cells.Biochem Pharmacol. 2013 Apr 1;85(7):1007-17. doi: 10.1016/j.bcp.2013.01.023. Epub 2013 Feb 8. Biochem Pharmacol. 2013. PMID: 23396089 Free PMC article.
-
Fenretinide Improves Intestinal Barrier Function and Mitigates Alcohol Liver Disease.Front Pharmacol. 2021 Mar 18;12:630557. doi: 10.3389/fphar.2021.630557. eCollection 2021. Front Pharmacol. 2021. PMID: 33815111 Free PMC article.
-
The mitochondrial PKCδ/retinol signal complex exerts real-time control on energy homeostasis.Biochim Biophys Acta Mol Cell Biol Lipids. 2020 Nov;1865(11):158614. doi: 10.1016/j.bbalip.2020.158614. Epub 2020 Jan 10. Biochim Biophys Acta Mol Cell Biol Lipids. 2020. PMID: 31927141 Free PMC article. Review.
References
-
- Arch JR. Lessons in obesity from transgenic animals. J Endocrinol Invest 25: 867–875, 2002 - PubMed
-
- Ball MD, Furr HC, Olson JA. Enhancement of acyl coenzyme A:retinol acyltransferase in rat liver and mammary tumor tissue by retinyl acetate and its competitive inhibition by N-(4-hydroxyphenyl) retinamide. Biochem Biophys Res Commun 128: 7–11, 1985 - PubMed
-
- Berni R, Formelli F. In vitro interaction of fenretinide with plasma retinol-binding protein and its functional consequences. FEBS Lett 308 1: 43–45, 1992 - PubMed
-
- Cho YM, Youn BS, Lee H, Lee N, Min SS, Kwak SH, Lee HK, Park KS. Plasma retinol-binding protein-4 concentrations are elevated in human subjects with impaired glucose tolerance and type 2 diabetes. Diabetes Care 11: 2457–2461, 2006 - PubMed
-
- Cushman SW, Salans LB. Determinations of adipose cell size and number in suspensions of isolated rat and human adipose cells. J Lipid Res 19: 269–273, 1978 - PubMed
Publication types
MeSH terms
Substances
Grants and funding
LinkOut - more resources
Full Text Sources
Other Literature Sources
Medical
Research Materials
Miscellaneous