

Direct quantitative determination of ceramide glycosylation in vivo: a new approach to evaluate cellular enzyme activity of glucosylceramide synthase
- PMID: 19826105
- PMCID: PMC2842142
- DOI: 10.1194/jlr.D002949
Direct quantitative determination of ceramide glycosylation in vivo: a new approach to evaluate cellular enzyme activity of glucosylceramide synthase
Abstract
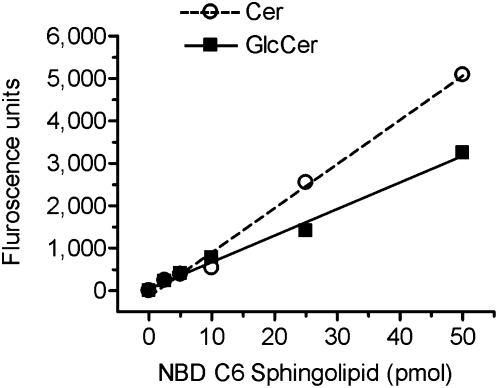
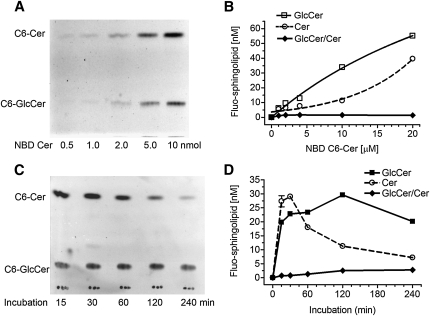
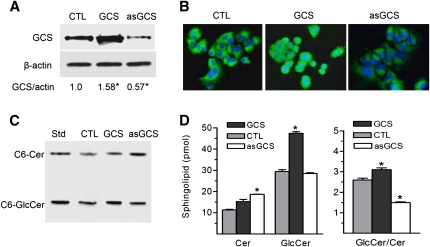
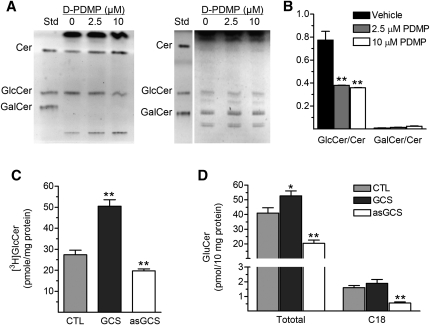
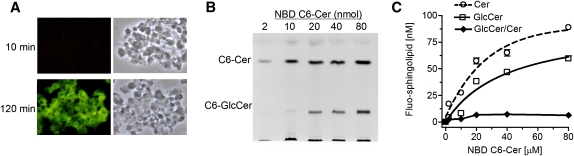
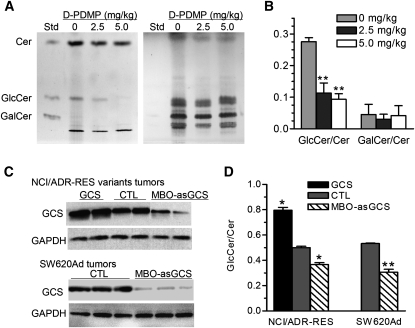
Glucosylceramide synthase (GCS or GlcT-1), converting ceramide to glucosylceramide, is a key enzyme for the synthesis of glycosphingolipids. Due to its diverse roles in physiology and diseases, GCS may be a disease marker and drug target. Current assays for enzymes including GCS are based on reactions conducted in a test tube using enzyme preparations. Measurement of enzyme activity in laboratory-made conditions cannot directly evaluate the role of GCS in cells. Here, we introduce a new approach to determine GCS cellular activity using fluorescent NBD C6-ceramide in vivo. Cellular GCS transfers UDP-glucose to NBD C6-ceramide and produces NBD C6-glucosylceramide. C6-glucosylceramide is then separated from C6-ceramide by thin-layer chromatography and both are then quantitated by spectrophotometer. This cell-based method is able to quantitate glucosylceramide in pmol range, produced by approximately 50,000 cells or 1.0 mg tissue. This method has been used successfully to evaluate the degrees of GCS enzyme in cells and in tumors subjected to gene manipulation and chemical inhibition. These data indicate that this cell-based fluorescent method is direct, reproducible, and simple for assessing ceramide glycosylation. It is applicable to validate GCS activity in drug-resistant cancers and in other disorders.
Figures
Similar articles
-
Incorporation of Fluorescence Ceramide-Based HPLC Assay for Rapidly and Efficiently Assessing Glucosylceramide Synthase In Vivo.Sci Rep. 2017 Jun 7;7(1):2976. doi: 10.1038/s41598-017-03320-9. Sci Rep. 2017. PMID: 28592871 Free PMC article.
-
Tyrosine-phosphorylation and activation of glucosylceramide synthase by v-Src: Its role in survival of HeLa cells against ceramide.Biochim Biophys Acta Mol Cell Biol Lipids. 2021 Jan;1866(1):158817. doi: 10.1016/j.bbalip.2020.158817. Epub 2020 Sep 25. Biochim Biophys Acta Mol Cell Biol Lipids. 2021. PMID: 32980536
-
Suppression of glucosylceramide synthase restores p53-dependent apoptosis in mutant p53 cancer cells.Cancer Res. 2011 Mar 15;71(6):2276-85. doi: 10.1158/0008-5472.CAN-10-3107. Epub 2011 Jan 28. Cancer Res. 2011. PMID: 21278235 Free PMC article.
-
Ceramide glycosylation catalyzed by glucosylceramide synthase and cancer drug resistance.Adv Cancer Res. 2013;117:59-89. doi: 10.1016/B978-0-12-394274-6.00003-0. Adv Cancer Res. 2013. PMID: 23290777 Free PMC article. Review.
-
Therapeutic potential of targeting ceramide/glucosylceramide pathway in cancer.Cancer Chemother Pharmacol. 2013 Jan;71(1):13-20. doi: 10.1007/s00280-012-1984-x. Epub 2012 Oct 17. Cancer Chemother Pharmacol. 2013. PMID: 23073611 Review.
Cited by
-
Gb3-cSrc complex in glycosphingolipid-enriched microdomains contributes to the expression of p53 mutant protein and cancer drug resistance via β-catenin-activated RNA methylation.FASEB Bioadv. 2020 Sep 2;2(11):653-667. doi: 10.1096/fba.2020-00044. eCollection 2020 Nov. FASEB Bioadv. 2020. PMID: 33205006 Free PMC article.
-
Sphingolipids are required for efficient triacylglycerol loss in conjugated linoleic Acid treated adipocytes.PLoS One. 2015 Apr 23;10(4):e0119005. doi: 10.1371/journal.pone.0119005. eCollection 2015. PLoS One. 2015. PMID: 25906159 Free PMC article.
-
Glucosylceramide transferase activity is critical for encystation and viable cyst production by an intestinal protozoan, Giardia lamblia.J Biol Chem. 2013 Jun 7;288(23):16747-16760. doi: 10.1074/jbc.M112.438416. Epub 2013 Apr 14. J Biol Chem. 2013. PMID: 23589290 Free PMC article.
-
Glucosylceramide synthase upregulates MDR1 expression in the regulation of cancer drug resistance through cSrc and beta-catenin signaling.Mol Cancer. 2010 Jun 11;9:145. doi: 10.1186/1476-4598-9-145. Mol Cancer. 2010. PMID: 20540746 Free PMC article.
-
3-Ketone-4,6-diene ceramide analogs exclusively induce apoptosis in chemo-resistant cancer cells.Bioorg Med Chem. 2014 Feb 15;22(4):1412-20. doi: 10.1016/j.bmc.2013.12.065. Epub 2014 Jan 8. Bioorg Med Chem. 2014. PMID: 24457089 Free PMC article.
References
-
- Basu S., Kaufman B., Roseman S. 1968. Enzymatic synthesis of ceramide-glucose and ceramide-lactose by glycosyltransferases from embryonic chicken brain. J. Biol. Chem. 243: 5802–5804 - PubMed
-
- Basu S., Kaufman B., Roseman S. 1973. Enzymatic synthesis of glucocerebroside by a glucosyltransferase from embryonic chicken brain. J. Biol. Chem. 248: 1388–1394 - PubMed
-
- Basu S., Basu M., Dastgheib S., Hawes J. W. 1999. Biosynthesis and regulation of glycosphingolipids. Comprehensive Natural Products Chemistry. Pinto B. M., editor Pergamon, New York: 107–128
Publication types
MeSH terms
Substances
Grants and funding
LinkOut - more resources
Full Text Sources
Other Literature Sources
