

STARNET 2: a web-based tool for accelerating discovery of gene regulatory networks using microarray co-expression data
- PMID: 19828039
- PMCID: PMC2765977
- DOI: 10.1186/1471-2105-10-332
STARNET 2: a web-based tool for accelerating discovery of gene regulatory networks using microarray co-expression data
Abstract
Background: Although expression microarrays have become a standard tool used by biologists, analysis of data produced by microarray experiments may still present challenges. Comparison of data from different platforms, organisms, and labs may involve complicated data processing, and inferring relationships between genes remains difficult.
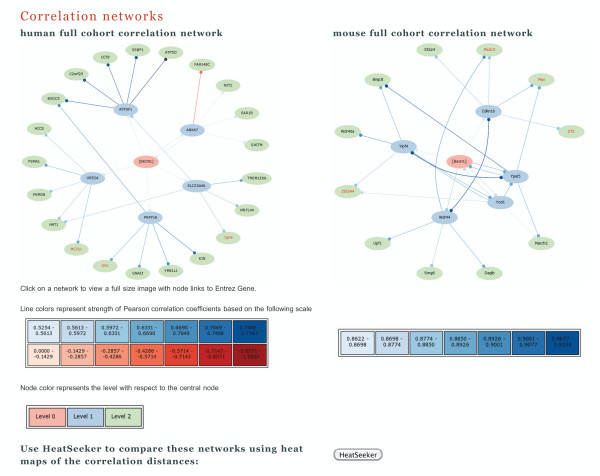
Results: STARNET 2 is a new web-based tool that allows post hoc visual analysis of correlations that are derived from expression microarray data. STARNET 2 facilitates user discovery of putative gene regulatory networks in a variety of species (human, rat, mouse, chicken, zebrafish, Drosophila, C. elegans, S. cerevisiae, Arabidopsis and rice) by graphing networks of genes that are closely co-expressed across a large heterogeneous set of preselected microarray experiments. For each of the represented organisms, raw microarray data were retrieved from NCBI's Gene Expression Omnibus for a selected Affymetrix platform. All pairwise Pearson correlation coefficients were computed for expression profiles measured on each platform, respectively. These precompiled results were stored in a MySQL database, and supplemented by additional data retrieved from NCBI. A web-based tool allows user-specified queries of the database, centered at a gene of interest. The result of a query includes graphs of correlation networks, graphs of known interactions involving genes and gene products that are present in the correlation networks, and initial statistical analyses. Two analyses may be performed in parallel to compare networks, which is facilitated by the new HEATSEEKER module.
Conclusion: STARNET 2 is a useful tool for developing new hypotheses about regulatory relationships between genes and gene products, and has coverage for 10 species. Interpretation of the correlation networks is supported with a database of previously documented interactions, a test for enrichment of Gene Ontology terms, and heat maps of correlation distances that may be used to compare two networks. The list of genes in a STARNET network may be useful in developing a list of candidate genes to use for the inference of causal networks. The tool is freely available at http://vanburenlab.medicine.tamhsc.edu/starnet2.html, and does not require user registration.
Figures

References
-
- Grant GR, Manduchi E, Stoeckert CJJ. Analysis and management of microarray gene expression data. Curr Protoc Mol Biol. 2007;Chapter 19 Unit 19.6. - PubMed
Publication types
MeSH terms
LinkOut - more resources
Full Text Sources
Other Literature Sources
Molecular Biology Databases
