. 2009 Oct 14:9:251.
doi: 10.1186/1471-2148-9-251.

Cooperative social clusters are not destroyed by dispersal in a ciliate

Affiliations

Cooperative social clusters are not destroyed by dispersal in a ciliate

Nicolas Schtickzelle et al. BMC Evol Biol. .

Abstract

Background: The evolution of social cooperation is favored by aggregative behavior to facilitate stable social structure and proximity among kin. High dispersal rates reduce group stability and kin cohesion, so it is generally assumed that there is a fundamental trade-off between cooperation and dispersal. However, empirical tests of this relationship are rare. We tested this assumption experimentally using ten genetically isolated strains of a ciliate, Tetrahymena thermophila.

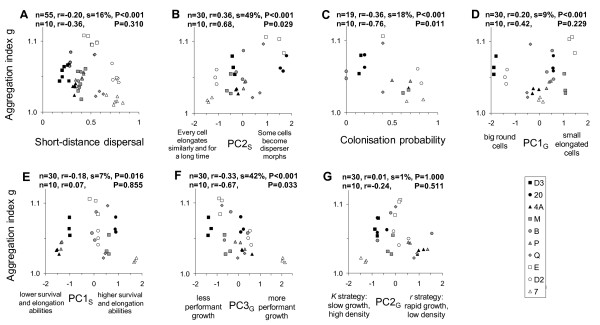
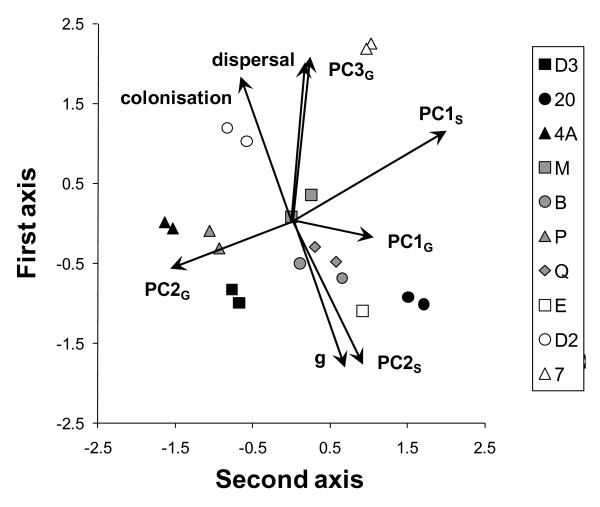
Results: The propensity for social aggregation was greater in strains with reduced cell quality and lower growth performance. While we found a trade-off between costly aggregation and local dispersal in phenotypic analyses, aggregative strains showed a dispersal polymorphism by producing either highly sedentary or long-distance dispersive cells, in contrast to less aggregative strains whose cells were monomorphic local dispersers.

Conclusion: High dispersal among aggregative strains may not destroy group stability in T. thermophila because the dispersal polymorphism allows social strains to more readily escape kin groups than less aggregative strains, yet still benefit from stable group membership among sedentary morphs. Such dispersal polymorphisms should be common in other social organisms, serving to alter the nature of the negative impact of dispersal on social evolution.


Figures

Figure 1
Figure 1
Tetrahymena thermophila dispersal morphs move substantially faster than normal morphs. Shown are the positions of two T. thermophila cells at three successive time points (6, 7 and 8 seconds from start in the movie accompanying our previous paper [30]; picture background is for time = 6 seconds), illustrating the much higher swim speed and net displacement of elongated dispersal morphs (circles) compared to round sedentary morphs (squares).
Figure 2
Figure 2
Example of a digital picture of Tetrahymena thermophila used to quantify aggregation behavior. The circle indicates limits of the study area, corresponding to the viewing field through the microscope. The magnified portion illustrates the point location (grey dots) of cells as computed by ImageJ analysis software, and the grid approximation used to compute the point pattern statistics via the Programita software (see text for details).
Figure 3
Figure 3
Quantification of cell aggregation from point pattern analysis. The pair-correlation function g(d) gives the expected number of points at distance d from an arbitrary point, divided by the intensity λ of the pattern. g(d) > 1 indicates aggregation, g(d) <1 regularity of the pattern at distance d. In this example of the picture displayed in Figure 2, cells are aggregated up to a distance of 14. Dashed lines: 95% confidence envelopes obtained from 19 simulations.
Figure 4
Figure 4
Aggregation tendency of the ten studied strains of Tetrahymena thermophila. Mean (and 95% confidence interval) aggregation index g is reported, based on ten replicates per strain (exceptions due to technical problems: 5 replicates for strain B and 9 replicates for strain D2).
Figure 5
Figure 5
Correlation of aggregation with seven other life-history traits of Tetrahymena thermophila. Those named "PC" are combinations of traits obtained from Principal Component Analyses; we describe their essence here but full details are given in [30]. The degree of cell aggregation under food rich conditions showed a negative relationship with short-distance dispersal including variation within and among strains, but not in more restrictive among strain analysis (A). Elongation strategy under starvation conditions was markedly associated with the tendency to aggregate, with strains where some cells elongated far more than others (up to becoming dispersal morphs) and for a shorter time showing stronger aggregation than strains where all cells elongated similarly for a long time (B). Strains that tended to aggregate strongly were less efficient as single-cell colonizers (C). Strains with small and elongated cells under food rich growth conditions showed a higher tendency to aggregate than strains with big and round cells, this effect was only present when within-strain variation was included (D). More aggregative strains showed reduced survival and average elongation abilities under starvation conditions when within strain variation was included in analyses (E). Strains growing faster and reaching a higher final cell density in the presence of nutrients were less inclined to aggregate (F). Growth strategy (K vs r) showed no relationship with aggregation (G). Because replicates of a given strain were not linked between experiments, we used a randomization procedure [38] to correlate parameters from different experiments, similar to the one used by [30]: the replicates of a given strain were randomly associated across experiments 1000 times, and a correlation was computed for each random association. n: sample size (limited by the experiment with the smaller sample size); r: mean Spearman's correlation over the 1000 random associations; s: proportion of significant correlations over the 1000 random associations; P: probability of obtaining s if the null hypothesis of no correlation is true. Points on each graph reflect the means of five random associations between the two traits to illustrate both between and within strain variations. The second line of statistics at the top of each graph gives results for Spearman correlations based on means of the 10 strains only, discarding variation between replicates of each strain.
Figure 6
Figure 6
Summary of the associations between aggregation and the seven other life-history traits of Tetrahymena thermophila. Principal component plot representing the associations between the first two component axes and component loading vectors for cell aggregation index g and the seven other life-history traits quantified for the ten T. thermophila strains studied [30]. Vectors that share a similar direction and length suggest traits that are more highly associated among cell strains. For the same reason that replicates of a given strain were not linked between experiments, points on the graph show means of five random associations between replicates of each strain to illustrate both between and within strain variation as in Figure 5. Results on analyses of the 10 strain means were extremely similar and are not shown.

Similar articles

Cited by

References

    1. Hamilton WD, May RM. Dispersal in stable habitats. Nature. 1977;269:578–581. doi: 10.1038/269578a0. - DOI
    1. Frank SA. Dispersal polymorphisms in subdivided populations. J Theor Biol. 1986;122:303–310. doi: 10.1016/S0022-5193(86)80122-9. - DOI - PubMed
    1. Taylor PD. An inclusive fitness model for dispersal of offspring. J Theor Biol. 1988;130:363–378. doi: 10.1016/S0022-5193(88)80035-3. - DOI
    1. Queller DC. Does population viscosity promote kin selection? Trends Ecol Evol. 1992;7:322–324. doi: 10.1016/0169-5347(92)90120-Z. - DOI - PubMed
    1. Axelrod R. The evolution of cooperation. New York: Basic Books; 1984.

Publication types

LinkOut - more resources