. 2009 Oct 15;10 Suppl 12(Suppl 12):S12.
doi: 10.1186/1471-2105-10-S12-S12.

Analysis and modelling of motility of cell populations with MotoCell

Affiliations

Analysis and modelling of motility of cell populations with MotoCell

Concita Cantarella et al. BMC Bioinformatics. .

Abstract

Background: Cell motility plays a central role in development, wound-healing and tumour invasion. Cultures of eukaryotic cells are a complex system where most cells move according to 'random' patterns, but may also be induced to a more coordinate migration by means of specific stimuli, such as the presence of chemical attractants or the introduction of a mechanical stimulus. Various tools have been developed that work by keeping track of the paths followed by specific objects and by performing statistical analysis on the recorded path data. The available tools include desktop applications or macros running within a commercial package, which address specific aspects of the process.

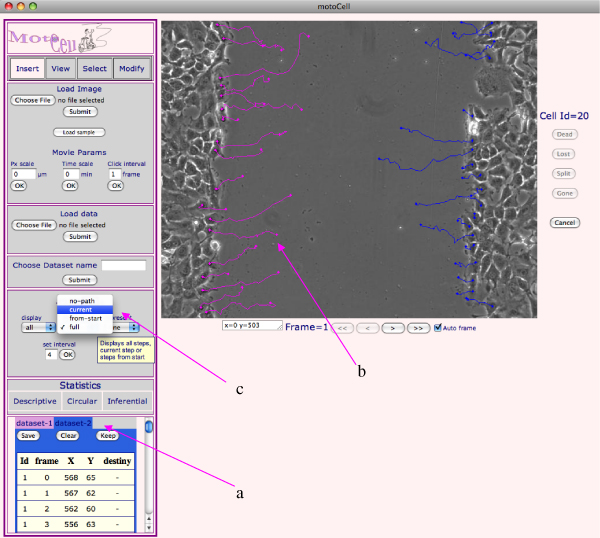
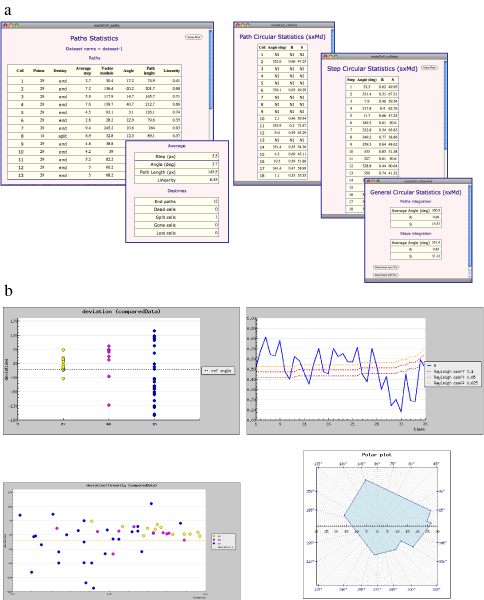
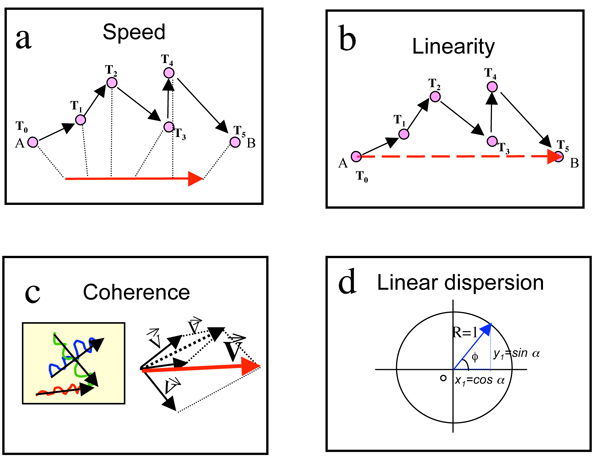
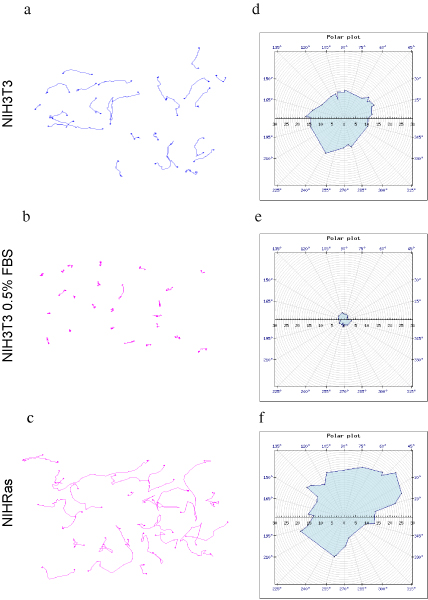
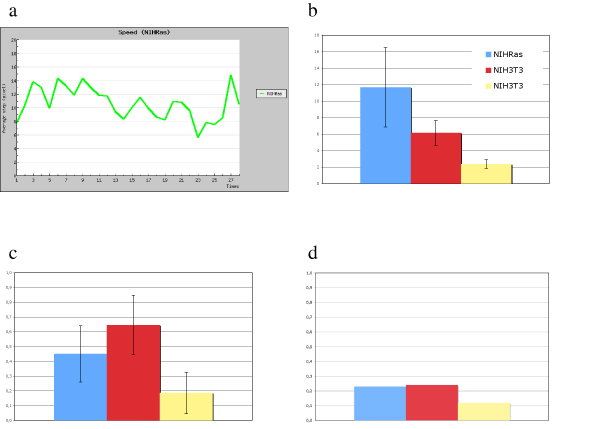
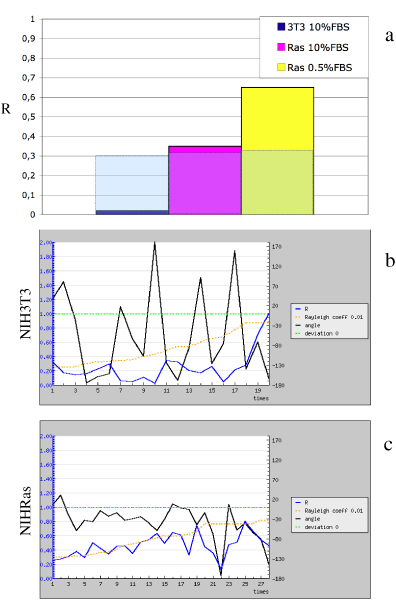
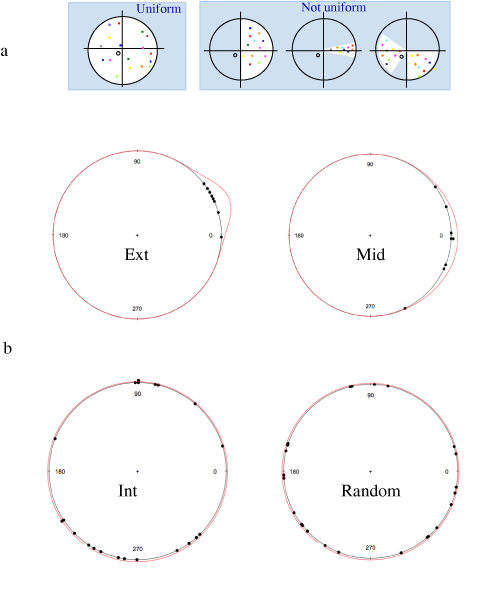
Results: An online application, MotoCell, was developed to evaluate the motility of cell populations maintained in various experimental conditions. Statistical analysis of cell behaviour consists of the evaluation of descriptive parameters such as average speed and angle, directional persistence, path vector length, calculated for the whole population as well as for each cell and for each step of the migration; in this way the behaviour of a whole cell population may be assessed as a whole or as a sum of individual entities. The directional movement of objects may be studied by eliminating the modulo effect in circular statistics analysis, able to evaluate linear dispersion coefficient (R) and angular dispersion (S) values together with average angles. A case study is provided where the system is used to characterize motility of RasV12 transformed NIH3T3 fibroblasts.

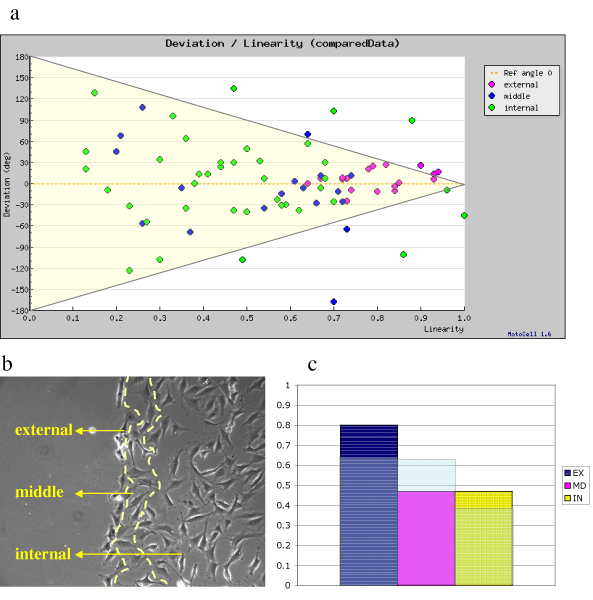
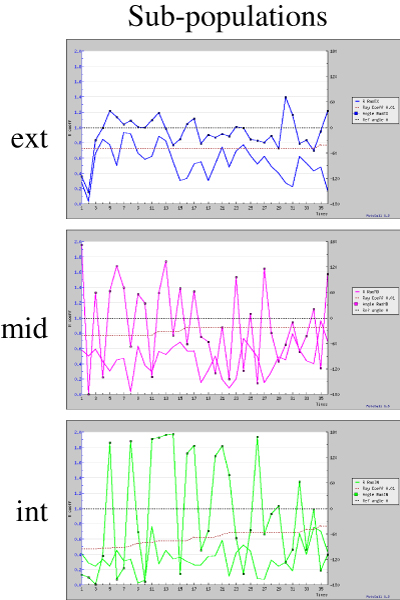
Conclusion: Here we describe a comprehensive tool which takes care of all steps in cell motility analysis, including interactive cell tracking, path editing and statistical analysis of cell movement, all within a freely available online service. Although based on a standard web interface, the program is very fast and interactive and is immediately available to a large number of users, while exploiting the web approach in a very effective way. The ability to evaluate the behaviour of single cells allows to draw the attention on specific correlations, such as linearity of movement and deviation from the expected direction. In addition to population statistics, the analysis of single cells allows to group the cells into subpopulations, or even to evaluate the behaviour of each cell with respect to a variable reference, such as the direction of a wound or the position of the closest cell.


Figures

Figure 1
Figure 1
MotoCell web interface. The main Motocell interface is used for all operations, including tracking, data handling and evaluation of statistical parameters. in MotoCell assists in cell tracking by recording the users clicks at the various positions in subsequent frames. For each step, coordinates are recorded within the table (a) located at the bottom of the Control area and displayed on the image as paths (b). When more datasets are used at the same time, they are alternatively visualized according to the chosen data tab; tab colors are used to match the tables with the corresponding paths on the image. A popup menu (c) allows to choose alternative path visualizations: incrementally from the beginning, only at the current time point or as a point sliding along the full path.
Figure 2
Figure 2
Output of statistical analysis. Examples of MotoCell results visualization: a) descriptive and circular statistics parameters, reported for each cell and as average values for the whole population; b) scatter plots, graphs and polar plots, used to show trends in time, path parameters, spatial distribution of directions.
Figure 3
Figure 3
Statistical parameter evaluation. a) Speed was calculated as the average of all step lengths; b) linearity as the ratio of net displacement, i.e. the distance between start and end point of a path, to path length; c) coherency of a population is defined as the ratio between length of the resulting vector, obtained by composing the displacement vectors for each cell path, and sum of the single net displacement vector lengths; d) linear dispersion coefficient R is defined as the module of a vector having its origin in the center of a circle with unit radius and direction the average angle ϕ.
Figure 4
Figure 4
Random motility analysis. Paths covered by NIHRas (a) and NIH3T3 in 10% (b) and 0.5% serum (c) moving on the culture surface. (d, e, f) Representation of the paths by using polar coordinates, for the three populations.
Figure 5
Figure 5
Evaluation of kinetic parameters. a) Average step length during the observation time. Plots showing average values for speed (b), expressed as μm/40' step, linearity (c) and coherency (d). NIHRas cells are in blue, NIH3T3 in 10% (red) and 0.5% (yellow) populations.
Figure 6
Figure 6
Evaluation of linear dispersion coefficient (R). R coefficients calculated for three cell populations in wound-healing assay (a). Deviation from the expected, i.e. towards the center of the wound, direction and R values are reported for each time point for NIH3T3 (b) and NIHRas (c) populations.
Figure 7
Figure 7
Relationship between deviation angle and linearity. a) Deviation from the expected direction, plotted as a function of linearity, in a population subjected to the wound stimulus. b) External, middle and internal sub-populations, identified according to their distance from the wound edge. c) R coefficient for the three sub-populations, compared to the threshold level for P = 0.01.
Figure 8
Figure 8
Time plots for the three subpopulations described in figure 7. Deviation angle and R coefficient, for the external, middle and internal cell subpopulation. In all plots, expected angle (black) and threshold level for P = 0.01 (red) are reported as a reference.
Figure 9
Figure 9
Circular plot of path directions. a) Examples of uniform and non-uniform distributions. b) Curves describing the best fitting von Mises distributions, overlaid onto the experimental points for external, middle, internal, and random populations.

Similar articles

Cited by

References

    1. Kurosaka S, Kashina A. Cell biology of embryonic migration. Birth Defects Res C Embryo Today. 2008;84:102–22. doi: 10.1002/bdrc.20125. - DOI - PMC - PubMed
    1. Sahai E. Illuminating the metastatic process. Nat Rev Cancer. 2007;7:737–49. doi: 10.1038/nrc2229. - DOI - PubMed
    1. Ridley AJ, Schwartz MA, Burridge K, Firtel RA, Ginsberg MH, Borisy G, Parsons JT, Horwitz AR. Cell migration: integrating signals from front to back. Science. 2003;302:1704–1709. doi: 10.1126/science.1092053. - DOI - PubMed
    1. Pollard TD, Borisy GG. Cellular motility driven by assembly and disassembly of actin filaments. Cell. 2003;112:453–465. doi: 10.1016/S0092-8674(03)00120-X. - DOI - PubMed
    1. Stupack DG. The biology of integrins. Oncology (Williston Park) 2007;21:6–12. - PubMed

Publication types

LinkOut - more resources