. 2009 Oct 15;10 Suppl 12(Suppl 12):S16.
doi: 10.1186/1471-2105-10-S12-S16.

Towards a systems biology approach to mammalian cell cycle: modeling the entrance into S phase of quiescent fibroblasts after serum stimulation

Affiliations

Towards a systems biology approach to mammalian cell cycle: modeling the entrance into S phase of quiescent fibroblasts after serum stimulation

Roberta Alfieri et al. BMC Bioinformatics. .

Abstract

Background: The cell cycle is a complex process that allows eukaryotic cells to replicate chromosomal DNA and partition it into two daughter cells. A relevant regulatory step is in the G0/G1 phase, a point called the restriction (R) point where intracellular and extracellular signals are monitored and integrated.Subcellular localization of cell cycle proteins is increasingly recognized as a major factor that regulates cell cycle transitions. Nevertheless, current mathematical models of the G1/S networks of mammalian cells do not consider this aspect. Hence, there is a need for a computational model that incorporates this regulatory aspect that has a relevant role in cancer, since altered localization of key cell cycle players, notably of inhibitors of cyclin-dependent kinases, has been reported to occur in neoplastic cells and to be linked to cancer aggressiveness.

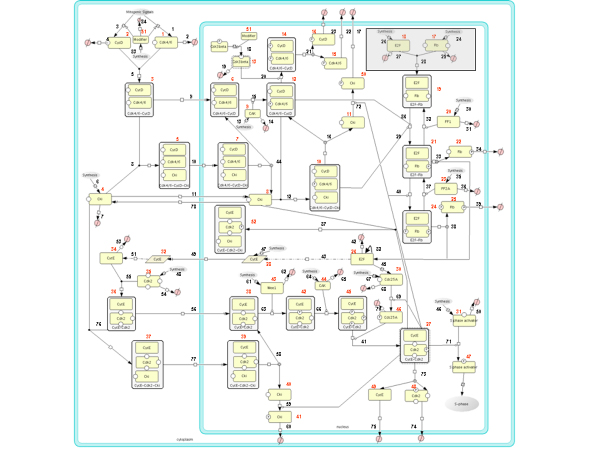
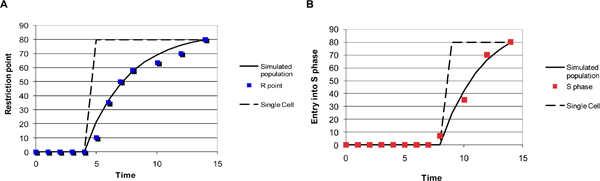
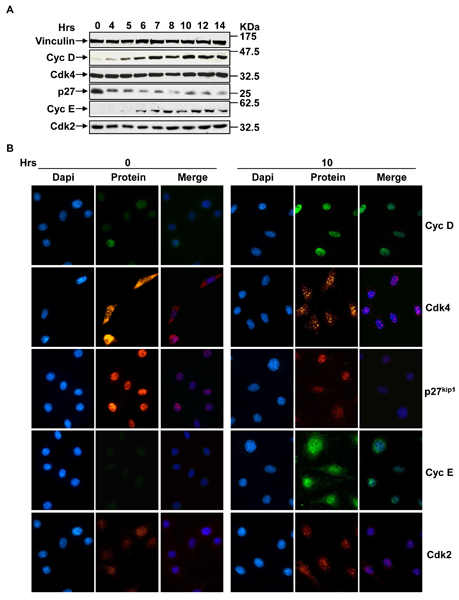
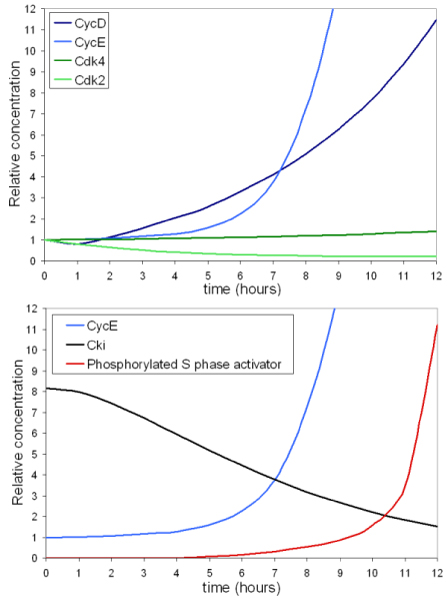
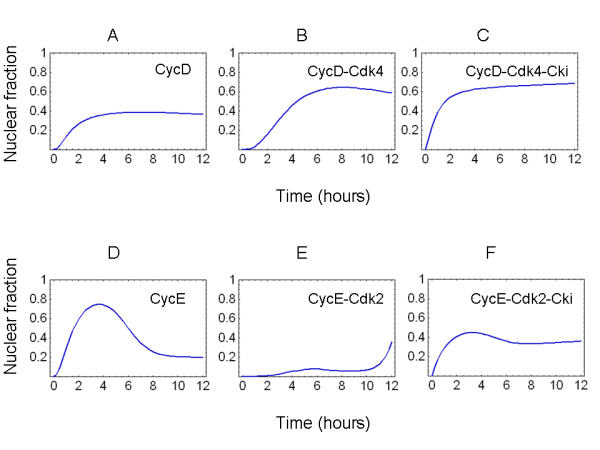
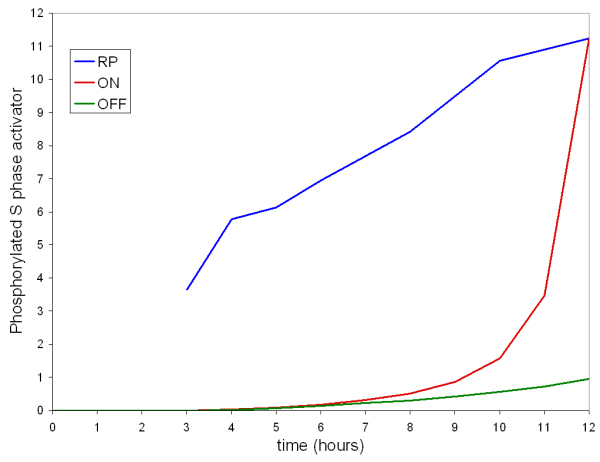
Results: The network of the model components involved in the G1 to S transition process was identified through a literature and web-based data mining and the corresponding wiring diagram of the G1 to S transition drawn with Cell Designer notation. The model has been implemented in Mathematica using Ordinary Differential Equations. Time-courses of level and of sub-cellular localization of key cell cycle players in mouse fibroblasts re-entering the cell cycle after serum starvation/re-feeding have been used to constrain network design and parameter determination. The model allows to recapitulate events from growth factor stimulation to the onset of S phase. The R point estimated by simulation is consistent with the R point experimentally determined.

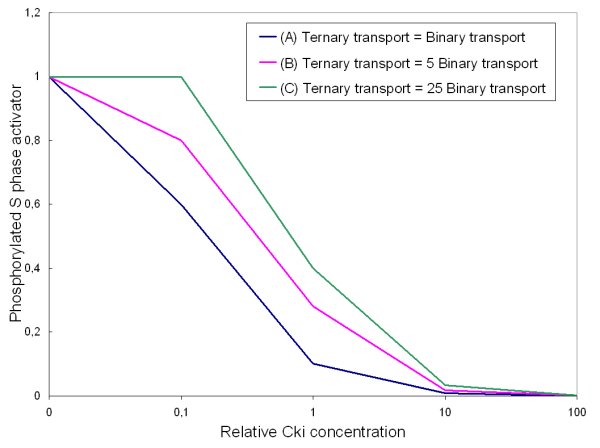
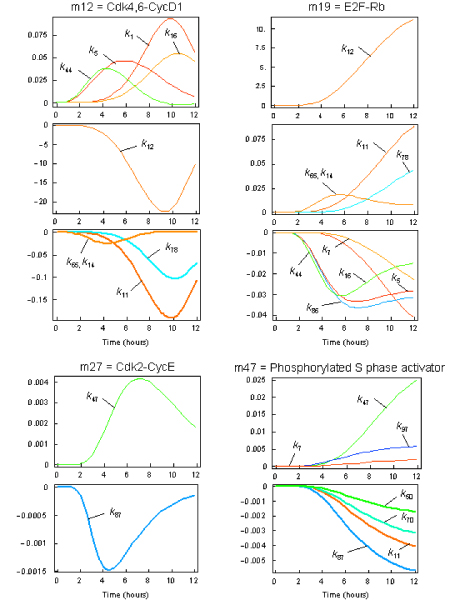
Conclusion: The major element of novelty of our model of the G1 to S transition is the explicit modeling of cytoplasmic/nuclear shuttling of cyclins, cyclin-dependent kinases, their inhibitor and complexes. Sensitivity analysis of the network performance newly reveals that the biological effect brought about by Cki overexpression is strictly dependent on whether the Cki is promoting nuclear translocation of cyclin/Cdk containing complexes.


Figures

Figure 1
Figure 1
Processes Regulating the G1/S transition in mammalian cells. Scheme of the G1 to S transition of the mammalian cell cycle drawn with Cell Designer. Two compartments are considered, cytoplasm and nucleus. The scheme follows the systems biology graphical notation (SBGN); each component is associated with a red number and each reaction is associated with a black number (Additional file 1). In the gray box a set of reactions which are not explicitly considered for the model.
Figure 2
Figure 2
Temporal parameters of the G1 to S transition in resting mammalian fibroblasts stimulated to proliferate by serum. NIH3T3 cells, made quiescient by serum starvation, were stimulated with 10% serum. For restriction point determination (panel A) cells were serum-starved again after different time periods and the fraction of BrdU-positive cells determined 14 hours after serum stimulation. Values of BrdU-positive cells at the end of the 14 hours (total time) are plotted as a function of the simulation time in the presence of serum. Fraction of BrdU-positive cells (B) was determined at different time point after serum stimulation. Experimental points are shown by colored symbols. Restriction point overcoming (panel A) or S phase state (panel B) are shown as on/off binary states by the dashed lines. Data for the population assuming a half-life of growth factor/cell interaction of 2 hours are shown as solid black lines fitting experimental data.
Figure 3
Figure 3
Expression and localization of cell cycle proteins in G1 to S transition. (A) Time-courses of the expression of proteins involved in the control of G1 to S transition. NIH3T3 cells, made quiescent by serum starvation, were stimulated with 10% serum and collected at appropriate time points and total cellular extracts were subjected to SDS-PAGE followed by Western blotting with appropriate antibodies. The Western blot is representative of at least three independent experiments. (B) Localization of proteins involved in the control of G1 to S transition at time 0 and 10 hours. NIH3T3 cells, after synchronization by serum starvation, were labeled with indicate antibodies (protein) and analyzed by fluorescence microscope. Nuclei were visualized by DAPI staining. The merged images are the result of a merge between the two single images acquired. At least 200 cells were scored for each sample and the images are representative of three independent experiments.
Figure 4
Figure 4
Simulated time courses for the total concentrations of G1 to S transition key players. Global dynamics describing the concentrations in time are reported for major cell cycle players. The phosphorylated S phase activator (the final output of the system whose level is proportional to probability of starting S phase) is also shown.
Figure 5
Figure 5
Nuclear localization of cyclins and their binary and ternary complexes. The nucleo/cytoplasmic ratio for cyclins and the relative binary and ternary complexes is shown. Results are shown for cyclin D and cyclin E (panels A and D, respectively), for cyclin D/Cdk4 and cyclin E/Cdk2 active complexes (panels B and E, respectively) and for the ternary complexes, cyclin D/Cdk4/Cki and cyclin E/Cdk2/Cki (panels C and F, respectively).
Figure 6
Figure 6
S phase entrance rate vs Cki relative concentration depending on the translocation of binary and ternary cyclin/Cdk complexes. The level of phosphorylated S phase activator at the end of the simulation (taken as a measure of the G1 to S transition) is shown as a function of relative Cki concentration at the beginning of the simulation. Three cases are presented: rate constants for the cytoplasm-to-nucleus translocation of binary and ternary cyclin/Cdk complexes are equal (blue line); the rate constants for the ternary complexes is 5-fold higher compared to the binary complexes translocation constants (pink line, corresponding to our standard simulation parameter set); the rate constants for the ternary complexes is 25-fold higher compared to the binary complexes translocation constants (green line).
Figure 7
Figure 7
Simulated Restriction point dynamics. Simulated accumulation of the phosphorylated S phase activator (taken as a measure of the G1 to S transition) upon growth factor stimulation ("ON" condition for the whole length of the simulation, red line), for a simulation run continuously in the "OFF" condition (green line) and summary of simulations run for R point determination (blue line). These simulations have been run for an increasing number of hours in the "ON" condition and for the time remaining to 12 hours in the "OFF" condition. Values of the phosphorylated S phase activator at the end of each 12 hours (total "ON" + "OFF" time) run are plotted as a function of the simulation time in the "ON" condition.
Figure 8
Figure 8
Sensitivity analysis of the G1 to S network. To test the impact of the parameter values on the dynamic behavior of the system, sensitivity analysis was performed by calculating so-called time-dependent response coefficients R = (∂ci (t)/ci (t))/(∂p/p) that allow to trace the time-dependent effect of a parameter change on a concentration during the whole simulation period. See Additional file 1 for a list of parameters.

Similar articles

Cited by

References

    1. Coller HA, Sang L, Roberts JM. A new description of cellular quiescence. PLoS biology. 2006;4:e83. doi: 10.1371/journal.pbio.0040083. - DOI - PMC - PubMed
    1. Iyer VR, Eisen MB, Ross DT, Schuler G, Moore T, Lee JC, Trent JM, Staudt LM, Hudson J, Jr, Boguski MS, et al. The transcriptional program in the response of human fibroblasts to serum. Science. 1999;283:83–87. doi: 10.1126/science.283.5398.83. - DOI - PubMed
    1. Pardee AB. A restriction point for control of normal animal cell proliferation. Proceedings of the National Academy of Sciences of the United States of America. 1974;71:1286–1290. doi: 10.1073/pnas.71.4.1286. - DOI - PMC - PubMed
    1. Pardee AB. G1 events and regulation of cell proliferation. Science. 1989;246:603–608. doi: 10.1126/science.2683075. - DOI - PubMed
    1. Hartwell LH, Culotti J, Pringle JR, Reid BJ. Genetic control of the cell division cycle in yeast. Science. 1974;183:46–51. doi: 10.1126/science.183.4120.46. - DOI - PubMed

Publication types

Substances

LinkOut - more resources