. 2009 Oct 15;10 Suppl 12(Suppl 12):S17.
doi: 10.1186/1471-2105-10-S12-S17.

Protopia: a protein-protein interaction tool

Affiliations

Protopia: a protein-protein interaction tool

Alejandro Real-Chicharro et al. BMC Bioinformatics. .

Abstract

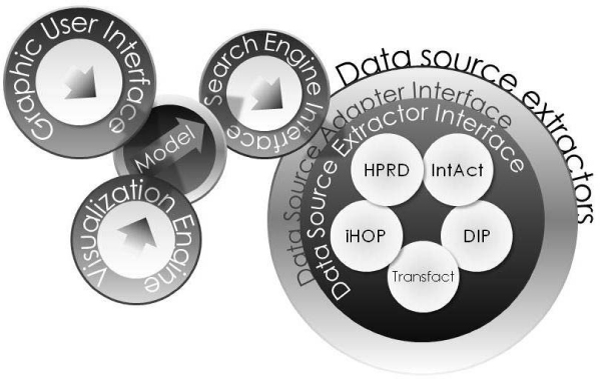
Background: Protein-protein interactions can be considered the basic skeleton for living organism self-organization and homeostasis. Impressive quantities of experimental data are being obtained and computational tools are essential to integrate and to organize this information. This paper presents Protopia, a biological tool that offers a way of searching for proteins and their interactions in different Protein Interaction Web Databases, as a part of a multidisciplinary initiative of our institution for the integration of biological data http://asp.uma.es.

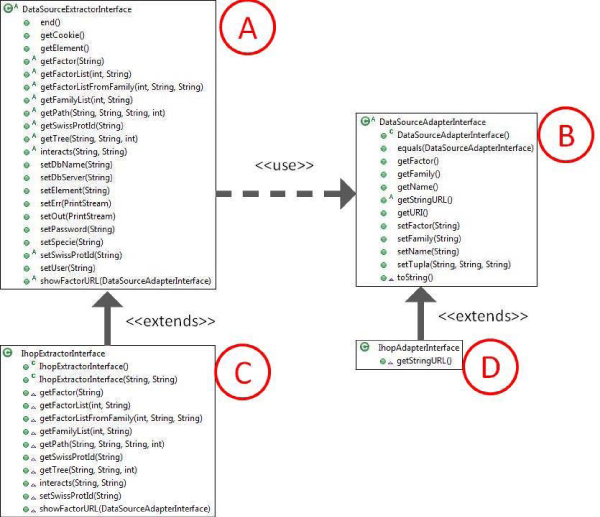
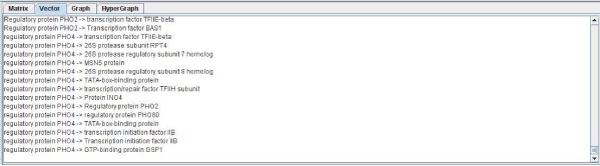
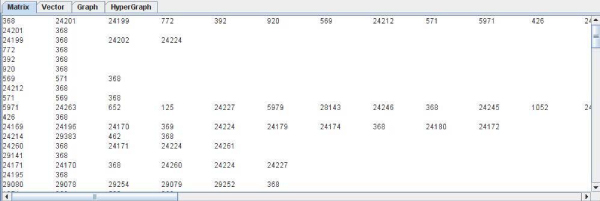
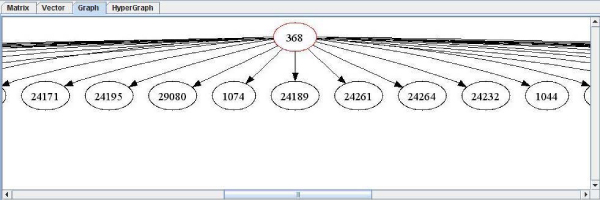
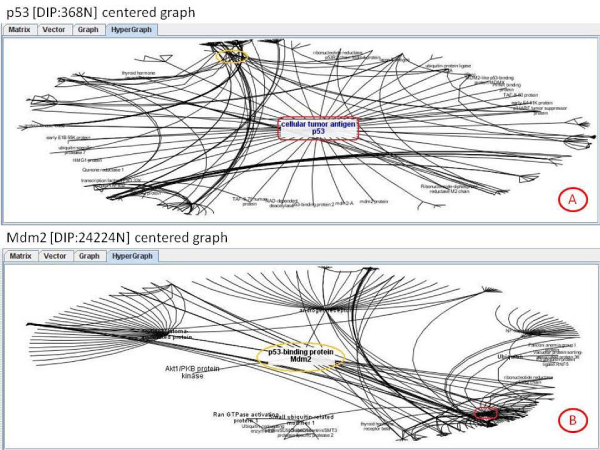
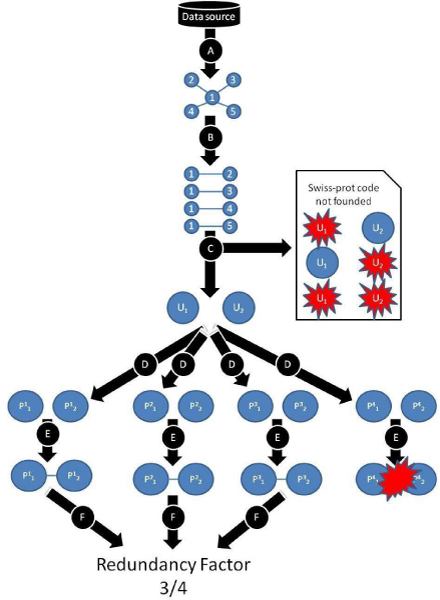
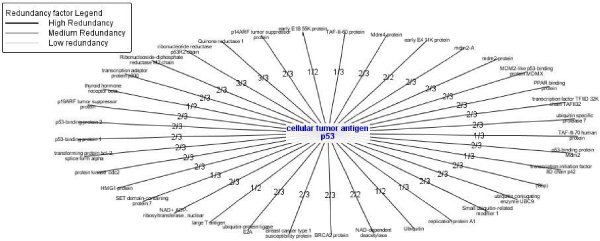
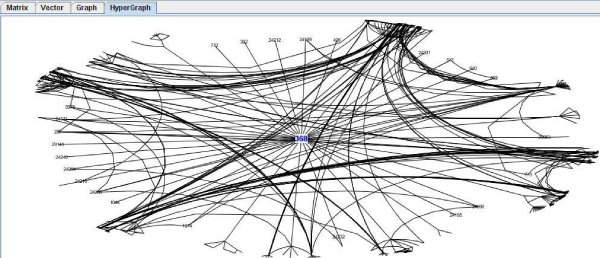
Results: The tool accesses the different Databases (at present, the free version of Transfac, DIP, Hprd, Int-Act and iHop), and results are expressed with biological protein names or databases codes and can be depicted as a vector or a matrix. They can be represented and handled interactively as an organic graph. Comparison among databases is carried out using the Uniprot codes annotated for each protein.

Conclusion: The tool locates and integrates the current information stored in the aforementioned databases, and redundancies among them are detected. Results are compatible with the most important network analysers, so that they can be compared and analysed by other world-wide known tools and platforms. The visualization possibilities help to attain this goal and they are especially interesting for handling multiple-step or complex networks.


Figures

Figure 1
Figure 1
Protopia's architecture. The diagram of Protopia's architecture shows the decoupling between all their components.
Figure 2
Figure 2
Data source extraction scheme. Abstract classes A and B define the operations required and implement the functionality between them. Scheme shows the class diagram which represents the extraction's implementation in IHOP. For other sources classes C and D are different.
Figure 3
Figure 3
Text vector implementation. The figure shows the results obtained from DIP for P53 [DIP:368] [SwissProt:P04367]. This kind of data representation was thought to allow experimented biologist to obtain a file with plain text as target for a program input.
Figure 4
Figure 4
Text matrix implementation. The figure shows the results obtained from DIP for P53 [DIP:368] [SwissProt:P04367]. This kind of data representation was thought to simplify the view of interactions in text mode.
Figure 5
Figure 5
Graphviz visual implementation. The figure shows the results obtained from DIP for P53 [DIP:368] [SwissProt:P04367]. This kind of graph view had a hierarchical layout capability, used to see the interactions by his level.
Figure 6
Figure 6
Hypergraph visual implementation. In A the view is centered over the P53 protein [DIP:368] [SwissProt:P04367]. In B the view is centered over the p53-binding protein Mdm2 [DIP:24224N] [SwissProt:Q00987].
Figure 7
Figure 7
Redundancy analysis algorithm scheme. In step A a network is captured from a given database. In step B, the network is decomposed into its interaction pairs. In step C, Protopia looks for the SwissProt code of both proteins of every pair captured. In step D, the specific database code (for each of the other databases) for the SwissProt code is located. In step E, the interactions between the specific codes of the pairs are located in all the other databases. Finally, step F checks if the interaction has been found, and in this case a unit is added to the redundancy factor numerator.
Figure 8
Figure 8
Redundancy analysis example. Redundancy analysis hypergraph of the "cellular tumor antigen" p53 network. The redundancy of ribonucleotide reductase p53R2 chain is the highest possible, and we will expect a high interaction probability.
Figure 9
Figure 9
Visualization. 4-level-deep network visualization of p53 protein [DIP:368] [SwissProt:P04367] that involves a total number of 836 proteins and 1595 interactions. The Figure is centered on p53 and is represented by an interactive organic graph as explained below.

Similar articles

Cited by

References

    1. Kiel C, Beltrao P, Serrano L. Analyzing protein interaction networks using structural information. Annu Rev Biochem. 2008;77:415–441. doi: 10.1146/annurev.biochem.77.062706.133317. - DOI - PubMed
    1. Rodríguez-Caso C, Sole R. Networks in cell biology. In: Dubitzky W, Granzow M, Berrar D, editor. Fundamentals of Data Mining in Genomics and Proteomics. Kluwer Academic Publishers; 2006.
    1. Misteli T. The concept of self-organization in cellular architecture. J Cell Biol. 2001;155:181–185. doi: 10.1083/jcb.200108110. - DOI - PMC - PubMed
    1. De Las Rivas J, de Luis A. Interactome data and databases: different types of protein interaction. Comp Funct Genomics. 2004;5:173–178. doi: 10.1002/cfg.377. - DOI - PMC - PubMed
    1. Palotai R, Szalay MS, Csermely P. Chaperones as integrators of cellular networks: changes of cellular integrity in stress and diseases. IUBMB Life. 2008;60:10–18. - PubMed

Publication types

LinkOut - more resources