

Clinical bioinformatics for complex disorders: a schizophrenia case study
- PMID: 19828082
- PMCID: PMC2762071
- DOI: 10.1186/1471-2105-10-S12-S6
Clinical bioinformatics for complex disorders: a schizophrenia case study
Abstract
Background: In the diagnosis of complex diseases such as neurological pathologies, a wealth of clinical and molecular information is often available to help the interpretation. Yet, the pieces of information are usually considered in isolation and rarely integrated due to the lack of a sound statistical framework. This lack of integration results in the loss of valuable information about how disease associated factors act synergistically to cause the complex phenotype.
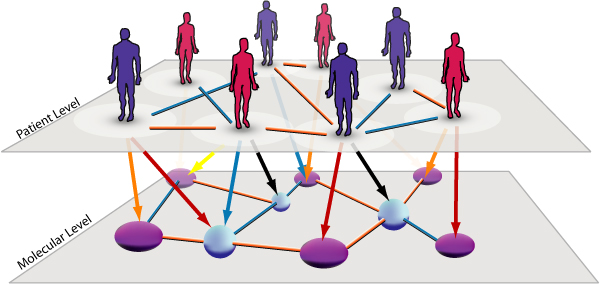
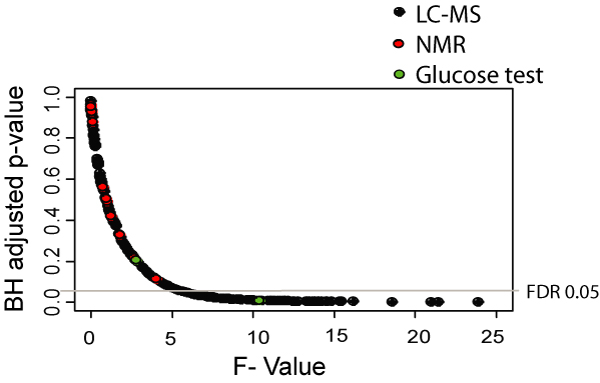
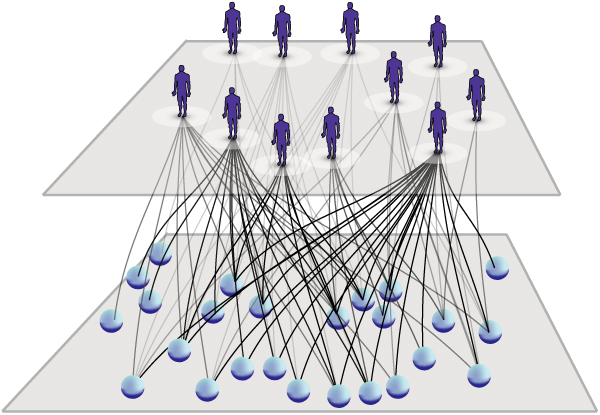
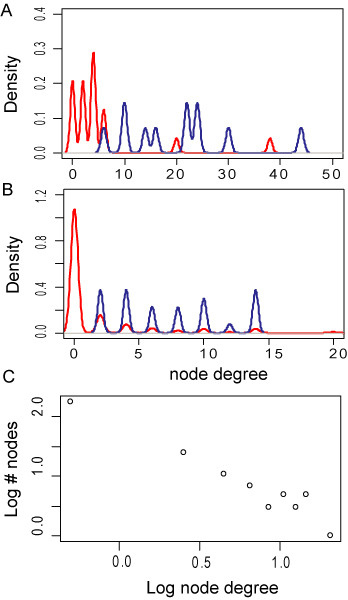
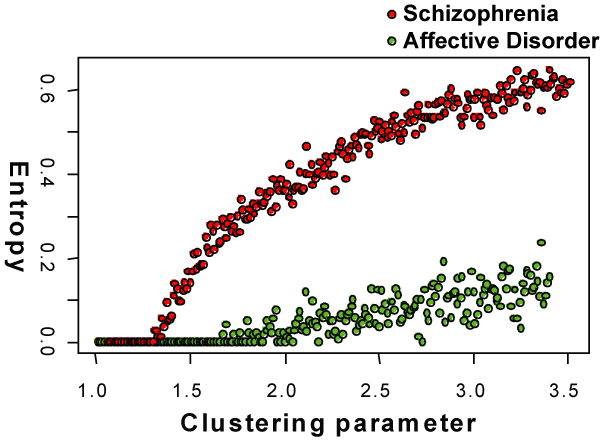
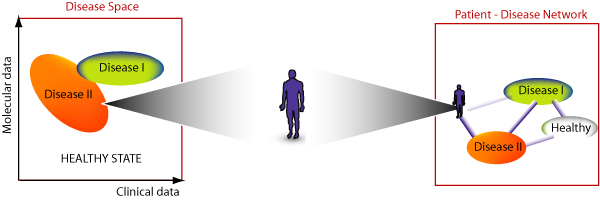
Results: Here, we investigated complex psychiatric diseases as networks. The networks were used to integrate data originating from different profiling platforms. The weighted links in these networks capture the association between the analyzed factors and allow the quantification of their relevance for the pathology. The heterogeneity of the patient population was analyzed by clustering and graph theoretical procedures. We provided an estimate of the heterogeneity of the population of schizophrenia and detected a subgroup of patients featuring remarkable abnormalities in a network of serum primary fatty acid amides. We compared the stability of this molecular network in an extended dataset between schizophrenia and affective disorder patients and found more stable structures in the latter.
Conclusion: We quantified robust associations between analytes measured with different profiling platforms as networks. The methodology allows the quantitative evaluation of the complexity of the disease. The identified disease patterns can then be further investigated with regards to their diagnostic utility or help in the prediction of novel therapeutic targets. The applied framework is able to enhance the understanding of complex psychiatric diseases, and may give novel insights into drug development and personalized medicine approaches.
Figures
Similar articles
-
Investigating aberrantly expressed microRNAs in peripheral blood mononuclear cells from patients with treatment‑resistant schizophrenia using miRNA sequencing and integrated bioinformatics.Mol Med Rep. 2020 Nov;22(5):4340-4350. doi: 10.3892/mmr.2020.11513. Epub 2020 Sep 15. Mol Med Rep. 2020. PMID: 33000265 Free PMC article.
-
[Schizophrenia diagnostic announcement in a French psychiatric unit].Encephale. 2005 Jul-Aug;31(4 Pt 1):449-55. doi: 10.1016/s0013-7006(05)82406-6. Encephale. 2005. PMID: 16389712 French.
-
Incorporating networks in a probabilistic graphical model to find drivers for complex human diseases.PLoS Comput Biol. 2017 Oct 12;13(10):e1005580. doi: 10.1371/journal.pcbi.1005580. eCollection 2017 Oct. PLoS Comput Biol. 2017. PMID: 29023450 Free PMC article.
-
New technologies provide insights into genetic basis of psychiatric disorders and explain their co-morbidity.Psychiatr Danub. 2010 Jun;22(2):190-2. Psychiatr Danub. 2010. PMID: 20562745 Review.
-
[Are schizophrenic patients being told their diagnosis today in France?].Encephale. 2017 Apr;43(2):160-169. doi: 10.1016/j.encep.2016.01.011. Epub 2016 Jun 29. Encephale. 2017. PMID: 27372353 Review. French.
Cited by
-
Pathway mapping and development of disease-specific biomarkers: protein-based network biomarkers.J Cell Mol Med. 2015 Feb;19(2):297-314. doi: 10.1111/jcmm.12447. Epub 2015 Jan 5. J Cell Mol Med. 2015. PMID: 25560835 Free PMC article. Review.
-
A primer on the use of machine learning to distil knowledge from data in biological psychiatry.Mol Psychiatry. 2024 Feb;29(2):387-401. doi: 10.1038/s41380-023-02334-2. Epub 2024 Jan 4. Mol Psychiatry. 2024. PMID: 38177352 Free PMC article. Review.
-
Clinical bioinformatics: a new emerging science.J Clin Bioinforma. 2011 Jan 20;1(1):1. doi: 10.1186/2043-9113-1-1. J Clin Bioinforma. 2011. PMID: 21884620 Free PMC article. No abstract available.
-
Massive human co-expression network and its medical applications.Chem Biodivers. 2012 May;9(5):868-87. doi: 10.1002/cbdv.201100355. Chem Biodivers. 2012. PMID: 22589089 Free PMC article.
-
SN algorithm: analysis of temporal clinical data for mining periodic patterns and impending augury.J Clin Bioinforma. 2013 Nov 28;3(1):24. doi: 10.1186/2043-9113-3-24. J Clin Bioinforma. 2013. PMID: 24283349 Free PMC article.
References
-
- Trent RJ. Methods in Molecular Medicine. 1. Humana Press Inc., U.S; 2007. Clinical Bioinformatics.
-
- Atanu Biswas, JPF, MRS, Sujay Datta, editor. Probability and Statistics. Wiley; 2008. Statistical Advances in the Biomedical Sciences: Clinical Trials, Epidemiology, Survival Analysis, and Bioinformatics.
-
- Boulesteix AL, Porzelius C, Daumer M. Microarray-based classification and clinical predictors: on combined classifiers and additional predictive value. Bioinformatics. 2008;24:1698–1706. - PubMed
-
- Nagl S. Cancer Bioinformatics: From Therapy Design to Treatment. John Wiley & Sons; 2006.
Publication types
MeSH terms
LinkOut - more resources
Full Text Sources
Other Literature Sources
Medical
