. 2009 Oct 27;106(43):18390-5.
doi: 10.1073/pnas.0905509106. Epub 2009 Oct 14.

Spatiotemporal precision and hemodynamic mechanism of optical point spreads in alert primates

Affiliations

Spatiotemporal precision and hemodynamic mechanism of optical point spreads in alert primates

Yevgeniy B Sirotin et al. Proc Natl Acad Sci U S A. .

Abstract

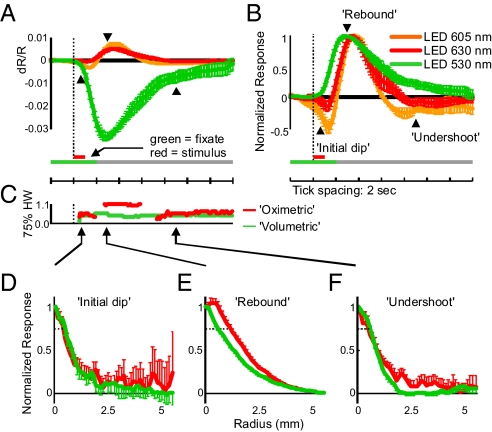
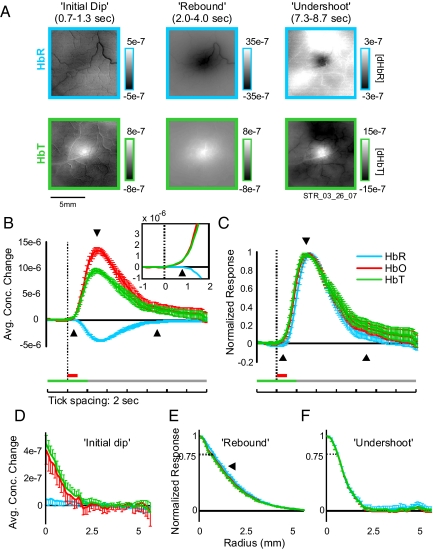
In functional brain imaging there is controversy over which hemodynamic signal best represents neural activity. Intrinsic signal optical imaging (ISOI) suggests that the best signal is the early darkening observed at wavelengths absorbed preferentially by deoxyhemoglobin (HbR). It is assumed that this darkening or "initial dip" reports local conversion of oxyhemoglobin (HbO) to HbR, i.e., oxygen consumption caused by local neural activity, thus giving the most specific measure of such activity. The blood volume signal, by contrast, is believed to be more delayed and less specific. Here, we used multiwavelength ISOI to simultaneously map oxygenation and blood volume [i.e., total hemoglobin (HbT)] in primary visual cortex (V1) of the alert macaque. We found that the hemodynamic "point spread," i.e., impulse response to a minimal visual stimulus, was as rapid and retinotopically specific when imaged by using blood volume as when using the initial dip. Quantitative separation of the imaged signal into HbR, HbO, and HbT showed, moreover, that the initial dip was dominated by a fast local increase in HbT, with no increase in HbR. We found only a delayed HbR decrease that was broader in retinotopic spread than HbO or HbT. Further, we show that the multiphasic time course of typical ISOI signals and the strength of the initial dip may reflect the temporal interplay of monophasic HbO, HbR, and HbT signals. Characterizing the hemodynamic response is important for understanding neurovascular coupling and elucidating the physiological basis of imaging techniques such as fMRI.


Conflict of interest statement

The authors declare no conflict of interest.

Figures

Fig. 1.
Fig. 1.
Optical imaging wavelengths and corresponding pointspreads. (A) In vitro absorbance spectra for HbR and HbO (molar extinction coefficients) along with normalized emission spectra for the three LEDs used. The full LED spectra were used to compute effective absorptions and path-lengths for the three imaging wavelengths (see Methods). (B) Imaged point spreads in one representative session. (Upper) Red: 630-nm (oximetric) LED. (Lower) Green: 530-nm (volumetric) LED. Image frames were averaged over the times in parentheses to capture the peaks of the initial dip, rebound, etc. of the oximetric signal. Note different scale bars to the right of each image.
Fig. 2.
Fig. 2.
Imaged point spreads at oximetric and volumetric wavelengths suggest a blood volume contribution to the initial dip. (A) Temporal profiles of signal changes measured at the point spread center, for the three LEDs used. Note the distinct triphasic signal at 605 and 630 nm vs. the monophasic signal at 530 nm averaged over all experiments. Error bars show the SEM. Dotted vertical line indicates stimulus onset. Arrowheads indicate time points used in the analysis of spatial profiles in C–E for the initial dip, rebound, and undershoot. (B) Same data as in A, but scaled to maximum for each session before averaging. Note the much larger initial dip and undershoot observed with 605 nm than with 630 nm. Also note that scaling the image makes it appear artifactually as if the initial dip at 605 and 630 nm starts earlier than changes at 530 nm. (C) Time courses of 75% half-widths for oximetric (red) and volumetric (green) point spreads. Time axis is aligned to A. (D–F) Radial profiles normalized to the center point, for oximetric (red, combining 605 and 630 nm) and volumetric (green, 530 nm) point spreads during the three response phases calculated by averaging the signal on radial annuli after masking off the vasculature. (D) Profiles early into the initial dip (t = 0.8 s) are shown. Note the similar spatial extent of both signals. Dashed lines indicate 75% response level. (E) Same as D, but for the rebound (t = 3 s). Note the much wider oximetric signal with an extended and rounded peak (red) vs. the sharp and narrow profile of the volumetric image (green). (F) Same as D, but for the undershoot (t = 9 s). Note the similarity of point spreads across wavelengths during the initial dip and undershoot.
Fig. 3.
Fig. 3.
Spectral decomposition of imaging signal shows no increase in HbR during the initial dip period as defined for the oximetric signal. (A) Spectrally decomposed point spreads: same experiment as in Fig. 1B. Conventions are as in Figs. 1 and 2. Only the images for HbR and HbT are shown. (B) The average temporal profile of concentration changes at response center after visual stimulation. Spectral decomposition was done separately for each experiment and then averaged. Conventions are as in Fig. 2A. Note the lack of any detectable increase in HbR despite clear initial dip signals in Fig. 2. (Inset) Magnified view of concentration changes during early portion of response, 1–2 s after stimulus. Note the early increase in HbT and the lack of any increase (only a late decrease) in HbR. (C) Same as B, but normalized to maximal response (HbR signal is thus flipped in sign). Note HbR signal lagging behind HbT at onset but decaying faster toward baseline. (D–F) The radial profiles of concentration changes for HbR, HbO, and HbT during the three oximetric response phases (as in Fig. 2). (D) Concentration changes early into the initial dip (t = 0.8 s). Unnormalized because there was no reliable change in HbR at this time point (see A and B). Compare with Fig. 2D. (E) Same as D, but for the rebound phase and scaled to maximum (t = 3 s). Note HbR signal is slightly broader than HbT. (F) Same as E, but for the undershoot phase (t = 9 s). Note similar point spreads in all components.
Fig. 4.
Fig. 4.
Changes in blood volume predict size of initial dip. (A) Molar extinction coefficient for HbR and HbO. Vertical dashed lines indicate isosbestic points. Shaded regions indicate: ranges where HbR absorbs more strongly than HbO. (B) Predicted response time courses at wavelengths moving from isosbestic to oxymetric marked in A, showing progression from a monophasic signal at the isosbestic 584 nm to a biphasic signal at 600 nm. (Note: The predicted signal time courses here are for the pure spectral wavelengths indicated; while qualitatively similar to our measured imaging signals they are quantitatively different because our LED sources had finite bandwidths giving the corresponding admixture of responses. All quantitative calculations using our LED sources accounted for this finite bandwidth; see Methods). (C) The predicted ratio of the size of the initial dip relative to the rebound across wavelength. Note an explosive increase in this ratio toward isosbestic points. (D) Predicted spatial profiles at 3 s poststimulus onset normalized to maximum response amplitude. Wavelengths same as in B. Note broader spreads at wavelengths showing a rebound. (Inset) Not normalized for amplitude.

Comment in

References

    1. Frostig RD, Lieke EE, Ts'o DY, Grinvald A. Cortical functional architecture and local coupling between neuronal activity and the microcirculation revealed by in vivo high-resolution optical imaging of intrinsic signals. Proc Natl Acad Sci USA. 1990;87:6082–6086. - PMC - PubMed
    1. Ogawa S, et al. Intrinsic signal changes accompanying sensory stimulation: Functional brain mapping with magnetic resonance imaging. Proc Natl Acad Sci USA. 1992;89:5951–5955. - PMC - PubMed
    1. Buxton RB. The elusive initial dip. NeuroImage. 2001;13:953–958. - PubMed
    1. Vanzetta I, Grinvald A. Evidence and lack of evidence for the initial dip in the anesthetized rat: Implications for human functional brain imaging. NeuroImage. 2001;13:959–967. - PubMed
    1. Nemoto M, et al. Functional signal- and paradigm-dependent linear relationships between synaptic activity and hemodynamic responses in rat somatosensory cortex. J Neurosci. 2004;24:3850–3861. - PMC - PubMed

Publication types

LinkOut - more resources