. 2009 Dec;20(24):5074-85.
doi: 10.1091/mbc.e09-04-0291.

Myosin IXa regulates epithelial differentiation and its deficiency results in hydrocephalus

Affiliations

Myosin IXa regulates epithelial differentiation and its deficiency results in hydrocephalus

Marouan Abouhamed et al. Mol Biol Cell. 2009 Dec.

Abstract

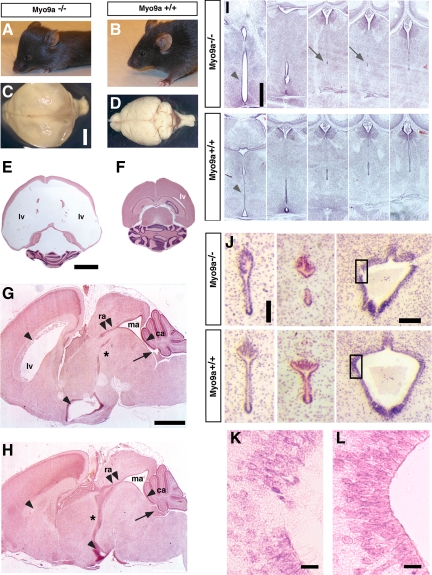
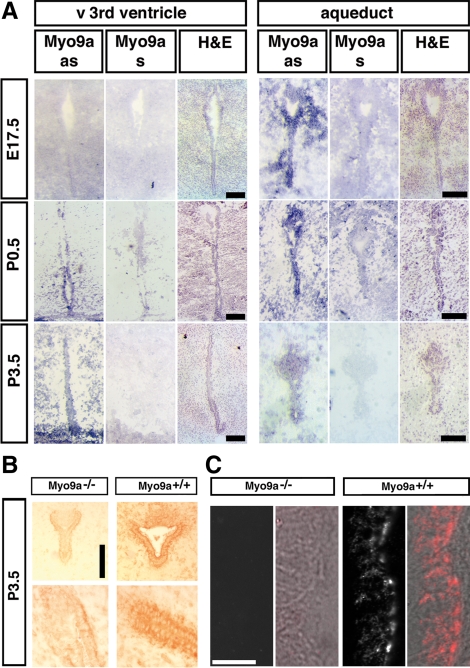
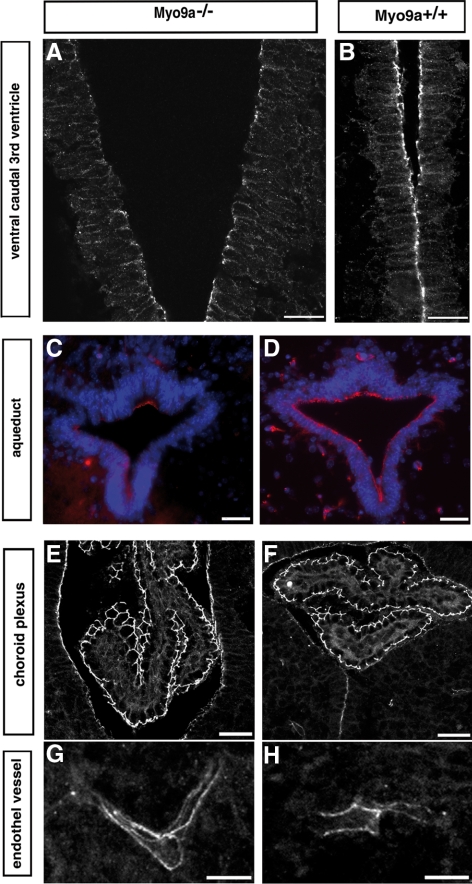
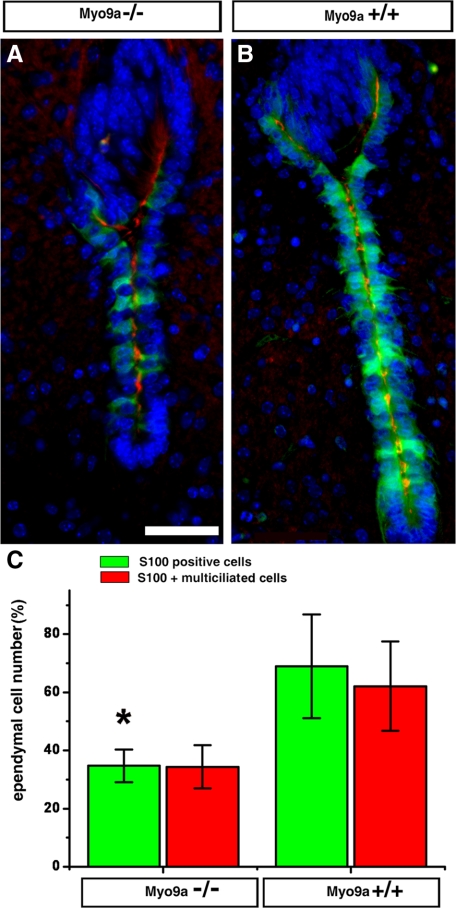
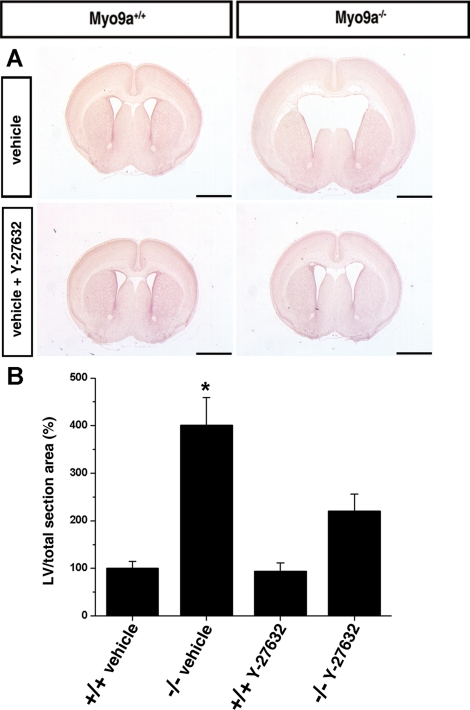
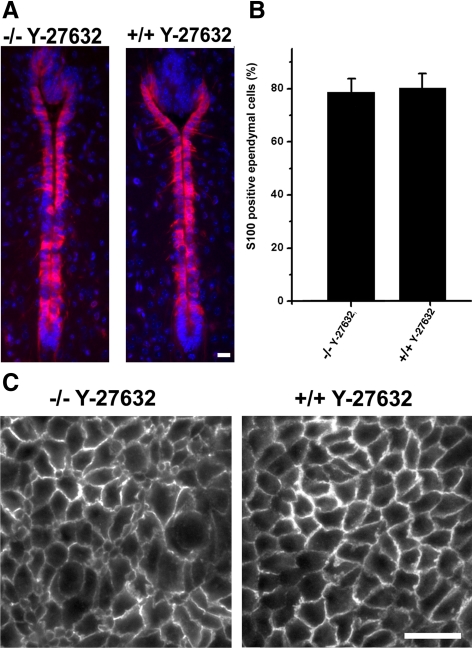
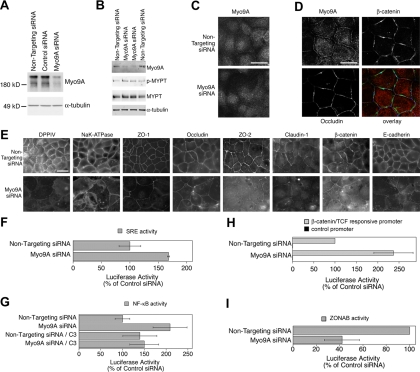
The ependymal multiciliated epithelium in the brain restricts the cerebrospinal fluid to the cerebral ventricles and regulates its flow. We report here that mice deficient for myosin IXa (Myo9a), an actin-dependent motor molecule with a Rho GTPase-activating (GAP) domain, develop severe hydrocephalus with stenosis and closure of the ventral caudal 3rd ventricle and the aqueduct. Myo9a is expressed in maturing ependymal epithelial cells, and its absence leads to impaired maturation of ependymal cells. The Myo9a deficiency further resulted in a distorted ependyma due to irregular epithelial cell morphology and altered organization of intercellular junctions. Ependymal cells occasionally delaminated, forming multilayered structures that bridged the CSF-filled ventricular space. Hydrocephalus formation could be significantly attenuated by the inhibition of the Rho-effector Rho-kinase (ROCK). Administration of ROCK-inhibitor restored maturation of ependymal cells, but not the morphological distortions of the ependyma. Similarly, down-regulation of Myo9a by siRNA in Caco-2 adenocarcinoma cells increased Rho-signaling and induced alterations in differentiation, cell morphology, junction assembly, junctional signaling, and gene expression. Our results demonstrate that Myo9a is a critical regulator of Rho-dependent and -independent signaling mechanisms that guide epithelial differentiation. Moreover, Rho-kinases may represent a new target for therapeutic intervention in some forms of hydrocephalus.


Figures

Figure 1.
Figure 1.
Myo9a-deficient mice develop hydrocephalus and stenosis of the ventral caudal 3rd ventricle and the aqueduct. (A and B) Comparison of lateral views of 21.5-d-old Myo9a−/− and WT mice. All mutant mice (>P7.5, n = 23) display a domed skull characteristic of hydrocephalus. (C and D) Global brain analysis shows enlarged hemispheres and compressed olfactory bulbs/cerebellum in the mutant mice (C) compared with WT (D). Hydrocephalus was never detected in any of the WT or heterozygous mice (n = 63) as well as homozygous type II (floxed) control animals (n = 98), demonstrating that the transgene did not result in hydrocephalus formation per se. (E and F) H&E-stained horizontal sections through identical areas of the brain demonstrate extreme dilation of the lateral ventricles in P14.5 mutant animals (E) compared with the WT littermate controls (F). (G and H) H&E-stained sagittal brain sections demonstrate dilation of the lateral ventricles (lv) and the ventral 3rd ventricle (arrowheads), but not of the fourth ventricle (arrow), in P3.5 Myo9a−/− (G) compared with WT animals (H). The ventral caudal 3rd ventricle (*) and the rostral aqueduct (double arrowheads) are stenosed. ra, rostral aqueduct; ma, median aqueduct; ca, caudal aqueduct. Scale bars, 1 mm. (I) Coronal H&E-stained sections from P1.5 Myo9a−/− mutant brains show dilation of the ventral 3rd ventricle (arrowhead) due to partial stenosis of the ventral caudal 3rd ventricle (arrows) compared with the WT littermate control. Scale bar, 200 μm. (J) Stenosis of the aqueduct and denudation of the ependymal epithelial layer at restricted sites in P0.5 Myo9a−/− brains but not in the WT littermate control. Notably, closure of the third ventricle often precedes closure of the aqueduct, which becomes detectable at P0.5–P14.5. Scale bar, 100 μm. Quadrangles indicate enlarged areas in K and L showing denudation of the ependyma in Myo9a−/− brains. Scale bar, 20 μm.
Figure 2.
Figure 2.
Myo9a is expressed in the maturing and fully differentiated ependyma. (A) In situ RNA hybridizations in E17.5, P0.5, and P3.5 WT brains showed strong Myo9a expression; as, Myo9a anti-sense (blue stain) in the ependymal cell layer lining the 3rd ventricle (left) and the aqueduct (right) connecting the 3rd and 4th ventricles in P0.5 and P3.5 mice. Myo9a expression was also detectable in the aqueduct of E17.5 embryos but not in the ventral 3rd ventricle. Corresponding WT brain tissue probed with a sense riboprobe (Myo9a s) never showed reactivity. Scale bars, 50 μm. (B) Immunohistochemical detection of Myo9a expression in P3.5 ependymal cell layer and aqueduct using an affinity-purified rabbit-anti-Myo9a antibody (Tü78). Myo9a protein is strongly expressed (brown color) in the ependymal cell layer and more weakly expressed in surrounding brain tissue of the 3rd ventricle (right, bottom) and aqueduct (right, top) of P3.5 mice. In the Myo9a−/− mutant little unspecific staining is observed in ependymal cells. Bar, 100 μm. (C) Confocal images of the ependyma in the aqueduct at P3.5 stained for Myo9a using an affinity-purified rabbit anti-Myo9a antibody (Tü78). Fluorescence images and corresponding DIC images overlaid with fluorescence image (red) are shown. Scale bar, 10 μm.
Figure 3.
Figure 3.
Loss of Myo9a causes altered ependymal cell shape and distorts the ependymal epithelium in the ventral caudal 3rd ventricle and the aqueduct. (A and B) Double immunofluorescence staining of coronal sections from P0.5 Myo9a−/− (A) and WT littermate mice (B) with anti-E-cadherin (green; adherens junction marker), anti-acetylated tubulin (red; cilia marker), and DAPI showing distortion of the ependymal layer of the ventral caudal 3rd ventricle in Myo9a−/− mice compared with WT mice. Note the presence of apical cilia despite a distorted structure of the ependyma in Myo9a−/− mice (A). (C and D) Enlargement of selected areas from A and B, respectively, stained for E-cadherin, highlighting the distortion of the ependyma. (E and F) Immunofluorescence staining of sagittal sections from P3.5 Myo9a−/− and WT littermate mice with anti-β-catenin (adherens junction marker) showing the irregular cell shape of the ependymal cells and the distortion of the ependymal cell layer in Myo9a−/− mice. (G) Quantification of junction linearity in the ependymal epithelium. In sections stained for β-catenin junction length and the distance between vertices were measured to determine the linearity index that is defined by the ratio of junction length to the distance between vertices. This index is significantly increased in Myo9a−/− mice. *p < 0.05, n = 2 mice of each genotype. Several areas of 100 μm × 100 μm were analyzed with more than 100 cells in total from each genotype. (H and I) Staining of sagittal sections of the aqueduct from P3.5 Myo9a−/− (H) and WT littermate mice (I) with anti-β-catenin (green) and anti-S100 (red, marker of mature ependymal cells) showing stenosis, distortion, and multilayer formation of the ependyma in the aqueduct in Myo9a−/− mice. (J and K) Enlargements of selected areas in H and I, respectively, stained for β-catenin. (L–O) Coronal sections of partially fused ventral caudal 3rd ventricle stained for β-catenin (L and N) and S100 protein (M and O). Scale bars, 20 μm.
Figure 4.
Figure 4.
Occludin staining is decreased in tight junctions of ependymal epithelium of the ventral caudal 3rd ventricle and the aqueduct, but not in the epithelium of the choroid plexus or the endothelium lining the blood vessels. Immunofluorescence staining of coronal sections from P0.5 Myo9a−/− (A, C, E, and G) and WT littermate mice (B, D, F, and H) for occludin showing that it is reduced in tight junctions of the ependyma in the ventral caudal 3rd ventricle (A) and the aqueduct (C, red) from Myo9a−/− mouse brains. No difference in occludin staining was observed in the epithelium of the choroid plexus (E and F) and the endothelium lining the blood vessels (G and H) in Myo9a−/− compared with control tissue. Scale bars, (A and B) 20 μm; (C–H) 30 μm.
Figure 5.
Figure 5.
Myo9a deficiency decreases the number of S100 protein positive, multiciliated ependymal cells in the aqueduct. (A and B) Immunofluorescence staining of coronal sections from P0.5 Myo9a−/− (A) and WT mice (B) for S100 protein (green), acetylated tubulin (red), and DNA (blue). (C) Statistical analysis of S100-positive and multiciliated ependymal cells. The number of S100-positive ependymal cells was reduced in Myo9a−/− mice (34.7 ± 5.6%; n = 4) compared with Myo9a+/+ mice (68.9 ± 17.8%; n = 5; *p < 0.05). The number of multiciliated ependymal cells was similarly reduced (34.4 ± 7.4 vs. 62 ± 15.4%). Scale bar, 50 μm.
Figure 6.
Figure 6.
Hydrocephalus formation in Myo9a-deficient mice is attenuated by the inhibition of Rho-dependent kinase. (A and B) Oral administration of ROCK-inhibitor Y-27632 to pregnant mice attenuates hydrocephalus formation in newborns. (A) Representative H&E-stained coronal brain sections from vehicle control groups (Myo9a+/+, n = 18; Myo9a−/−, n = 18) that were maintained on tap water with sucrose (30% vol/wt) and from Y-27632 groups (Myo9a+/+, n = 18; Myo9a−/−, n = 20) that were maintained on tap water with Y-27632 (200 mg/l) and sucrose (30% vol/wt). The two groups were treated from E12.5 until P3.5. Bars, 1 mm. (B) Morphometric analysis. The ratio of the area covered by the lateral ventricle in a defined brain area (at the anterior commissure) to the total brain section area was determined and set to 100% in the control groups. Treatment of Myo9a−/− mice with Y-27632 ROCK-inhibitor significantly (*p < 0.01) attenuates LV enlargement.
Figure 7.
Figure 7.
Administration of ROCK-inhibitor Y-27632 rescues ependymal cell maturation, but not ependyma morphology. (A and B) Ependymal cells in the aqueduct of P3.5 Myo9a−/− and WT (Myo9a+/+) mice treated with ROCK inhibitor Y-27632 were stained for S100 protein (red), a marker of mature ependymal cells (A). Cell nuclei were stained with DAPI (blue). Scale bar, 20 μm. (B) Statistical analysis of S100-positive ependymal cells in the aqueduct of P3.5 Myo9a−/− and WT mice treated with Y-27632. No difference in numbers of mature ependymal cells could be detected. Five mice of each genotype were analyzed. (C) Cross sections of the ependyma in the aqueduct of P3.5 Myo9a−/− and WT (Myo9a+/+) mice treated with Y-27632. Sections were stained for β-catenin to visualize cell–cell junctions. Scale bar, 20 μm.
Figure 8.
Figure 8.
Depletion of Myo9a in Caco-2 cells alters cell morphology, differentiation, Rho-signaling and junctional signaling. (A) Caco-2 cells were transfected with control and Myo9a-targeting siRNAs. After 72 h, the cells were lysed, and expression of Myo9a was analyzed by immunoblotting total cell extacts. α-Tubulin was used as a loading control. (B) Samples of cells treated either with control or Myo9a-targeting siRNAs were analyzed by immunoblotting for the amount of phosphorylated (p-MYPT) and total myosin light chain phosphatase (MYPT). α-Tubulin served as a loading control. (C) Indirect immunofluorescence staining for Myo9a in cells treated with control or Myo9a-targeting siRNAs. Note the disappearance of the junctional staining in cells treated with Myo9a-targeting siRNA. Epifluorescence images; scale bar, 10 μm. (D) The junctional staining of Myo9a does not discriminate between tight and adherence junctions. Confocal sections were taken at the level of the junctions. Caco-2 cells were simultaneously stained for Myo9a, β-catenin, and occludin. Individual stainings and an overlay of the three stainings are shown. Scale bar, 10 μm. (E) Caco-2 cells were transfected with siRNAs as in A and were then fixed and processed for immunofluorescence. Shown are images for the apical marker DPPIV, the basolateral marker NaK-ATPase as well as a set of tight and adherens junction proteins. (F) Transcriptional activity of a reporter plasmid with SRE-dependent luciferase expression. Values obtained with nontargeting siRNAs were set to 100%. (G) Transcriptional activity of NF-κB as measured with a reporter plasmid harboring functional NF-κB-binding sites. Activities were determined in the absence and presence of the Rho-inhibitor C3 transferase (C3). (H and I) Transcriptional activities of β-catenin/TCF and ZONAB, respectively, were measured using luciferase reporter assays. For β-catenin/TCF, results obtained with a reporter plasmid with functional TCF-binding sites as well as with one lacking such sites are shown. For ZONAB, plasmids harboring a promoter with a ZONAB-binding site driving firefly luciferase expression and a promoter with an inactivated binding site but otherwise identical sequence driving renilla luciferase were cotransfected, and the resulting ratios were used to calculate ZONAB activity. Values obtained with nontargeting siRNAs were set to 100%. Values are means ± SD derived from three experiments performed in triplicates.

References

    1. Aijaz S., D'Atri F., Citi S., Balda M. S., Matter K. Binding of GEF-H1 to the tight junction-associated adaptor cingulin results in inhibition of Rho signaling and G1/S phase transition. Dev. Cell. 2005;8:777–786. - PubMed
    1. Assadi A. H., et al. Interaction of reelin signalling and Lis1 in brain development. Nat. Genet. 2003;3:270–276. - PubMed
    1. Bähler M. Class IX myosins. In: Coluccio L. M., editor. Myosins. Netherlands: Springer; 2008. pp. 391–401.
    1. Balda M. S., Matter K. Epithelial cell adhesion and the regulation of gene expression. Trends Cell Biol. 2003;13:310–318. - PubMed
    1. Balda M. S., Garrett M. D., Matter K. The ZO-1-associated Y-box factor ZONAB regulates epithelial cell proliferation and cell density. J. Cell Biol. 2003;160:423–432. - PMC - PubMed

Publication types

MeSH terms