. 2009 Oct 14;29(41):12729-34.
doi: 10.1523/JNEUROSCI.4366-09.2009.

A paradigm shift in functional brain imaging

Affiliations

A paradigm shift in functional brain imaging

Marcus E Raichle. J Neurosci. .
No abstract available


Figures

Figure 1.
Figure 1.
A, B, A comparison of activity decreases during the performance of goal-directed tasks in the DMN (A) and spontaneous BOLD fluctuations (B) within the same network in the resting state derived from regions of interest placed in the posterior cingulate/precuneus (yellow arrow) or the medial prefrontal cortex (orange arrow). The remarkable degree of coherence between activities obtained from these two distant loci within the same system is evident on inspection of these time–activity curves. The degree of system-wide coherence within the DMN is shown in C when all voxels in the brain are examined for their correlation with a region of interest in the posterior cingulate/precuneus (yellow arrow in A). Such a well delineated pattern of coherence within a known system is typical of all large-scale cortical systems and their subcortical connections. This figure was adapted with permission from M. E. Raichle (2009).
Figure 2.
Figure 2.
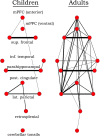
A graphic visualization of the correlation matrix within nodes of the DMN is presented in children (aged 7–9) on the left and adults (aged 21–31) on the right. The width of the line between two nodes depicts connection strength based on coherence of the resting-state fMRI BOLD signal (see Fig. 1). Noteworthy in these data is the differences in resting-state functional connectivity that accrue as the result of brain maturation. These data were reproduced with permission from D. A. Fair et al. (2008). inf., Inferior; lat., lateral; post., posterior; sup., superior.
Figure 3.
Figure 3.
A depiction of cross-frequency coupling of EEG frequencies from 1 to 40 Hz within the phase of ISF. The thick gray line denotes a descriptive ISF cycle. It should be noted that the correlation of the 1–40 Hz oscillation amplitudes (colored lines) with the ISF is similar to that of the behavioral data (black line). This figure was reproduced with permission from S. Monto et al. (2008).

References

    1. Ackermann RF, Finch DM, Babb TL, Engel J., Jr Increased glucose utilization during long-duration recurrent inhibition of hippocampal pyramidal cells. J Neurosci. 1984;4:251–264. - PMC - PubMed
    1. Ames A., 3rd CNS energy metabolism as related to function. Brain Res Rev. 2000;34:42–68. - PubMed
    1. Arieli A, Sterkin A, Grinvald A, Aertsen A. Dynamics of ongoing activity: explanation of the large variability in evoked cortical responses. Science. 1996;273:1868–1871. - PubMed
    1. Attwell D, Laughlin SB. An energy budget for signaling in the grey matter of the brain. J Cereb Blood Flow Metab. 2001;21:1133–1145. - PubMed
    1. Bandettini PA, Wong EC, Hinks RS, Tikofsky RS, Hyde JS. Time course EPI of human brain function during task activation. Magn Reson Med. 1992;25:390–397. - PubMed

Publication types