. 2009 Oct 14;29(41):12930-9.
doi: 10.1523/JNEUROSCI.3115-09.2009.

Cerebellar contributions to adaptive control of saccades in humans

Affiliations

Cerebellar contributions to adaptive control of saccades in humans

Minnan Xu-Wilson et al. J Neurosci. .

Abstract

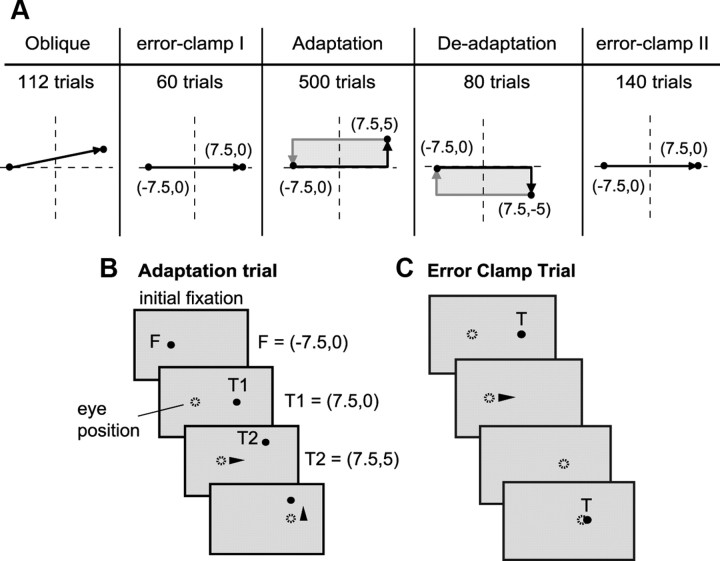
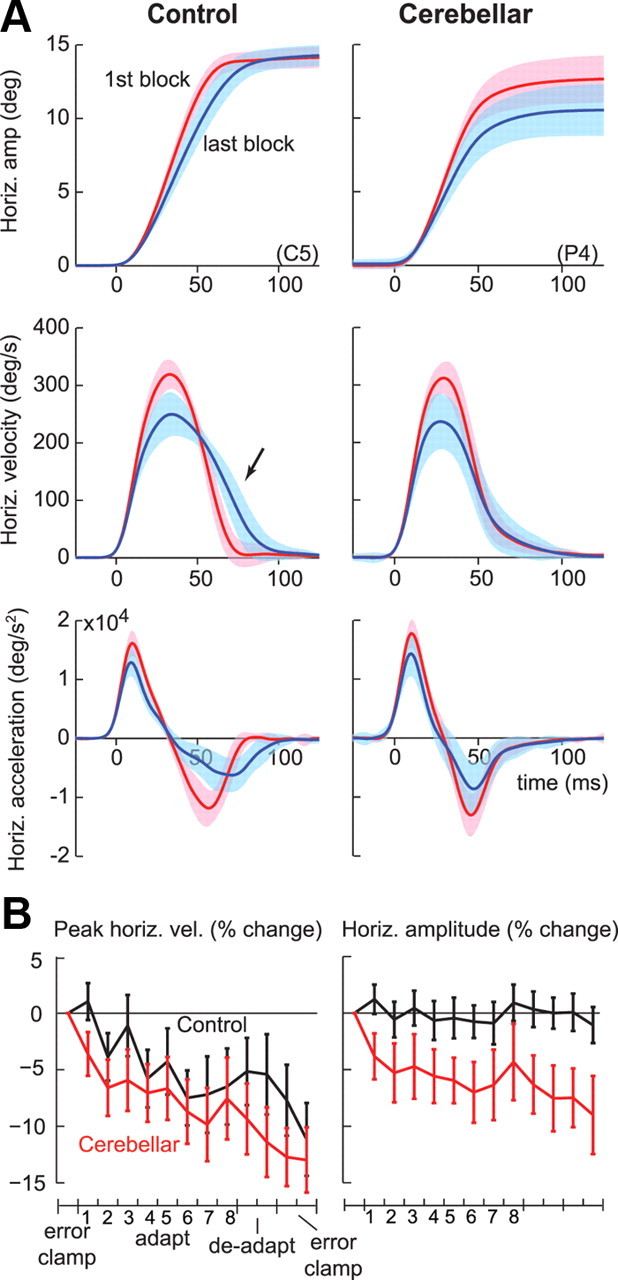
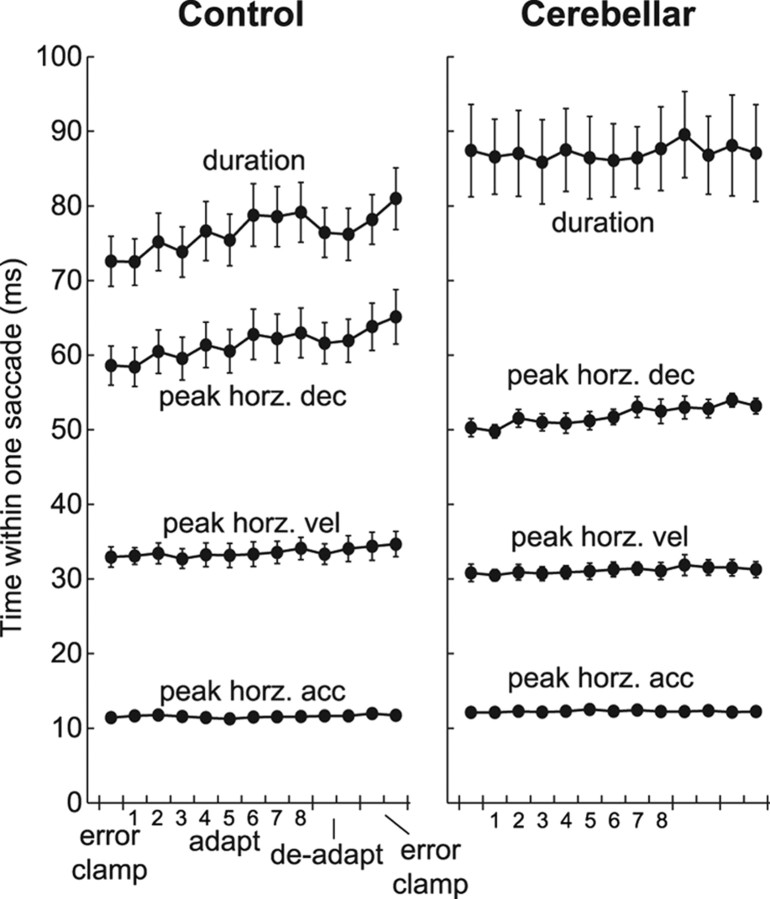
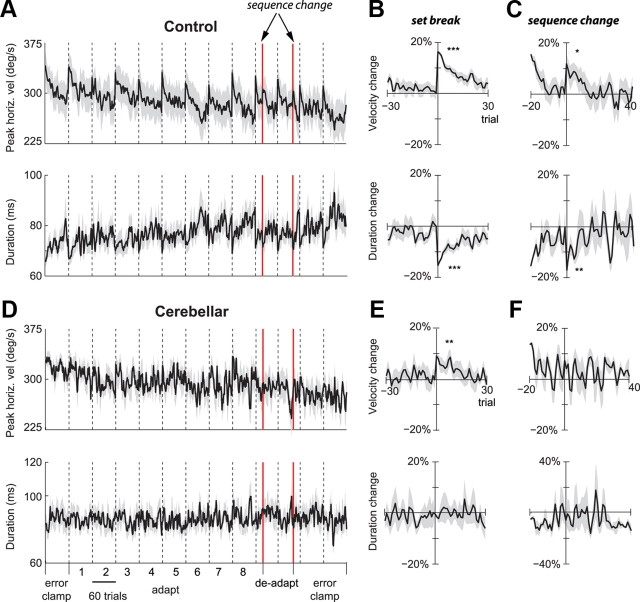
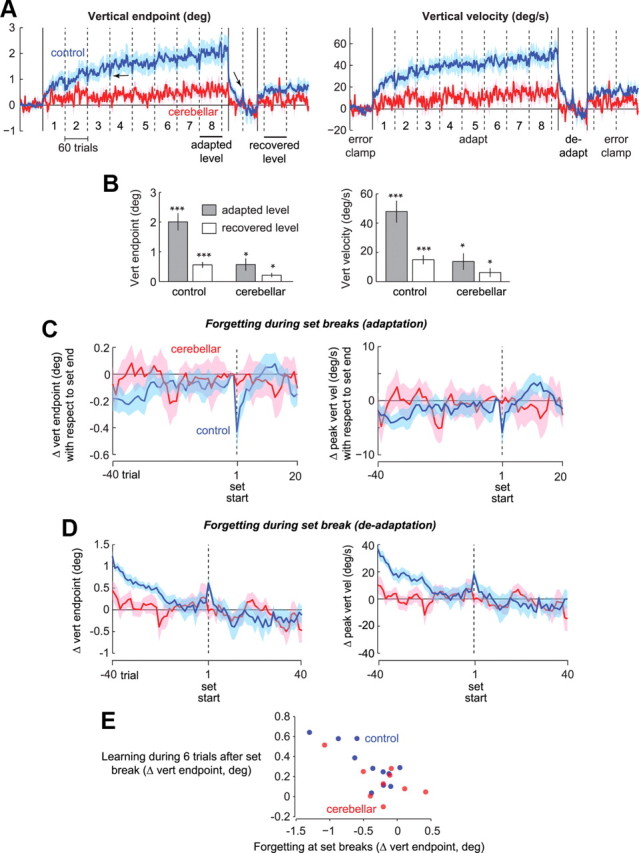
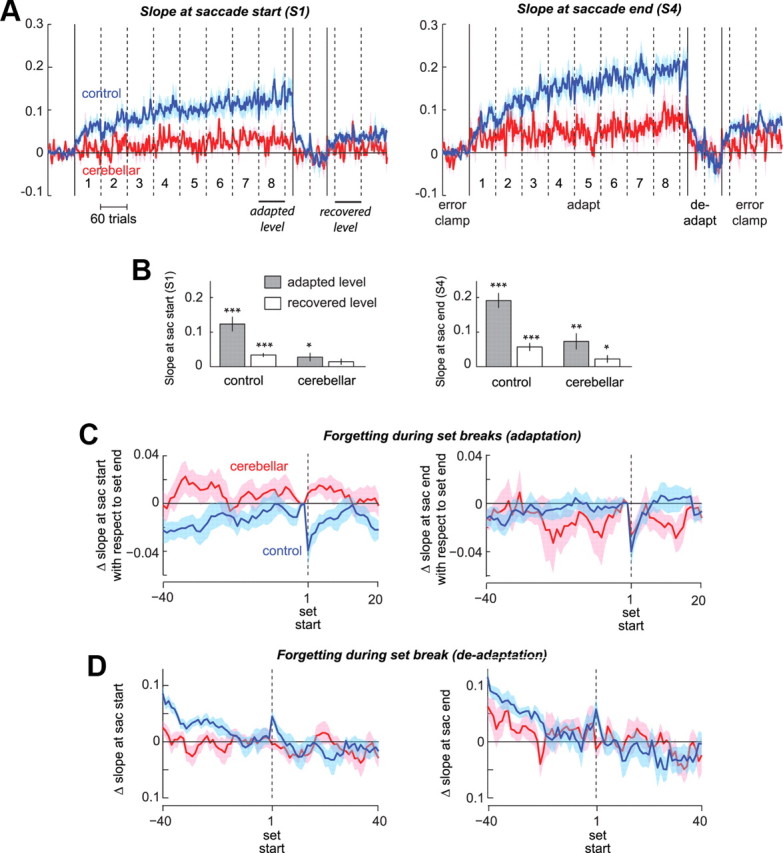
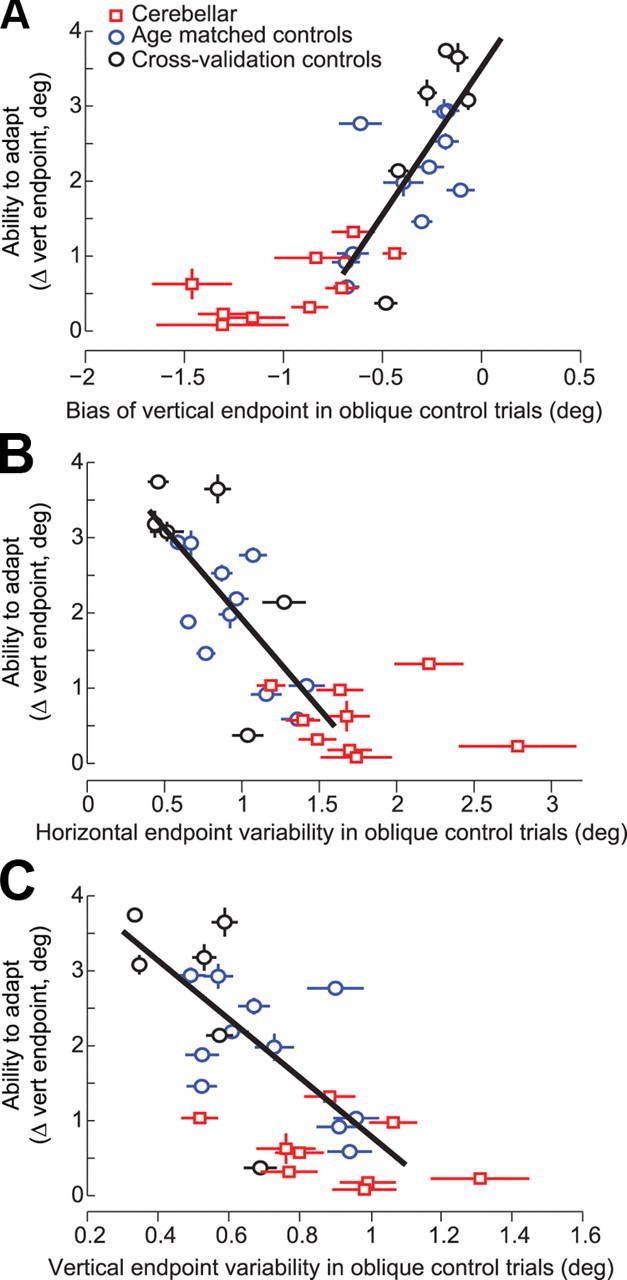
The cerebellum may monitor motor commands and through internal feedback correct for anticipated errors. Saccades provide a test of this idea because these movements are completed too quickly for sensory feedback to be useful. Earlier, we reported that motor commands that accelerate the eyes toward a constant amplitude target showed variability. Here, we demonstrate that this variability is not random noise, but is due to the cognitive state of the subject. Healthy people showed within-saccade compensation for this variability with commands that arrived later in the same saccade. However, in people with cerebellar damage, the same variability resulted in dysmetria. This ability to correct for variability in the motor commands that initiated a saccade was a predictor of each subject's ability to learn from endpoint errors. In a paradigm in which a target on the horizontal meridian jumped vertically during the saccade (resulting in an endpoint error), the adaptive response exhibited two timescales: a fast timescale that learned quickly from endpoint error but had poor retention, and a slow timescale that learned slowly but had strong retention. With cortical cerebellar damage, the fast timescale of adaptation was effectively absent, but the slow timescale was less impaired. Therefore, the cerebellum corrects for variability in the motor commands that initiate saccades within the same movement via an adaptive response that not only exhibits strong sensitivity to previous endpoint errors, but also rapid forgetting.


Figures

Figure 1.
Figure 1.
Experimental procedures. A, Subjects were trained on a cross-axis adaptation task. The experiment consisted of five blocks: trials in which saccade targets were presented at various oblique angles, 60 preadapt error-clamp trials in which targets were always at 15° horizontal (error-clamp I), 500 adaptation trials (target jump is counter-clockwise), 80 deadaptation trials (target jump is clockwise), and 140 postadapt error-clamp trials (error-clamp II, targets again at 15° horizontal). During error-clamp trials, the target did not jump but disappeared after saccade onset and reappeared 500 ms later at the current eye position. The dashed lines indicate axes centered straight ahead. B, Adaptation trials. Filled circles indicate current laser position. Arrowheads indicate when a saccade began. A target was projected 15° away from fixation (T1). As soon as the saccade began, the target jumped 5° vertically to a new location (T2). The jump direction was consistently counterclockwise to the orientation of T1. T2 then served as the fixation point (F) for the next trial. In deadaptation trials, the jump direction was clockwise to the orientation of T1. C, Error clamp trials. T1 was presented at 15° to the left or right of fixation. Once the saccade began, T1 disappeared. Five-hundred milliseconds later, a fixation point appeared with a horizontal position the same as T1 and a vertical position of the eye from 10 ms prior.
Figure 2.
Figure 2.
Cerebellar patients could not correct for variability in the motor commands that initiated saccades. A, The average horizontal amplitude, velocity, and acceleration traces from the first and last error-clamp blocks (error clamp I and II), in response to a target at 15°, for two representative subjects. In the last block, the saccades of both the control subject (C5) and the cerebellar patient (P4) were initiated with reduced velocities, but the control subject compensated later during the same saccade. Shading indicates SD. B, Group data for horizontal peak velocity and amplitude changes. Percentage change is with respect to the first error-clamp block (error clamp I). Each point is the average from one set of 60 trials. Error bars indicate SEM.
Figure 3.
Figure 3.
Saccades of control and cerebellar subjects differed most in the deceleration phase. The plots show the changes in the timing of saccade parameters. Position, velocity, and acceleration refer to horizontal components of the movement. Each point is the average from one set of 60 trials. Error bars indicate SEM.
Figure 4.
Figure 4.
Effect of set breaks on saccade horizontal velocities and durations. A, D, Peak vertical velocity and duration, averaged across each group. Dotted vertical lines mark set boundaries. Each set consisted of 60 trials. Red lines mark sudden changes in target sequence that occurred within sets without breaks. B, E, Within-subject changes in peak velocity and duration, aligned to set restart. The plots show percentage change with respect to the last bin of each set. The amount of recovery is calculated as the difference between the last and first bins (t test, *p < 0.05, **p < 0.01, ***p < 0.001). Shading indicates across subject SEM. C, F, Within-subject changes in peak velocity and duration, aligned to the sudden change in sequence of targets from CCW to CW cross-axis target jumps. A–C are control data, and D–F are cerebellar data.
Figure 5.
Figure 5.
The multiple timescales of adaptation. A, The plots show the vertical endpoint of the primary saccade and its peak vertical velocity. Cerebellar patients (red) are impaired in adapting to cross-axis target jumps compared with controls, but nevertheless show significant adaptation. In the deadapt period, the behavior of both groups returned to baseline, but in the following error-clamp trials, there was partial recovery. Dashed vertical lines denote set breaks. Solid vertical lines denote changes of trial types. Note that in the control group, there is forgetting (first arrow) at each set break followed by rapid relearning. Also note that forgetting reverses direction (second arrow) in the deadaptation period. B, Summary of the performance at the final set of adaptation and during the first 60 trials of error-clamp II in controls and patients (*p < 0.05, **p < 0.01, ***p < 0.001). Error bars indicate SEM. C, Vertical endpoint and velocity aligned on set start, as in Figure 4B. The forgetting followed by rapid relearning is present in controls but absent in patients. D, Vertical endpoint and velocity at the set break in the deadaptation block. Only the controls exhibit reverse-forgetting. Error bars indicate SEM. E, Rapid learning within the first 6 trials of each adaptation set and forgetting at set breaks for individual subjects. The control group showed a strong correlation of r2 = 0.62 with p < 0.004. The cerebellar subjects showed a marginally significant correlation of r2 = 0.40 with p = 0.067.
Figure 6.
Figure 6.
Early versus late part of single saccades. We divided each saccade into four equal horizontal segments and measured the slope of each segment. A, The slope at saccade start is termed S1 and the slope at saccade end S4. B, Summary of S1 and S4 at the final set of adaptation and the recovery seen during the first 60 trials of error-clamp II in controls and patients (*p < 0.05, **p < 0.01, ***p < 0.001). C, Within-subject change in S1 and S4 with respect to the end of the previous set. D, Within-subject change at the set break in the deadaptation block. Error bars indicate SEM.
Figure 7.
Figure 7.
The ability to compensate for internal sources of variability correlates with the ability to compensate for external sources of error. A, Correlation between bias in the vertical direction for oblique trials and learning along the vertical direction during adaptation. The best fit line is for control subjects. Error bars are SEM. B, C, Horizontal (or vertical) endpoint variability before adaptation is plotted on the x-axis and the ability to adapt to endpoint errors during adaptation trials is plotted on the y-axis. The best fit line is for all control subjects. Error bars for horizontal and vertical variability are SEs of the SD estimate.

References

    1. Barash S, Melikyan A, Sivakov A, Zhang M, Glickstein M, Thier P. Saccadic dysmetria and adaptation after lesions of the cerebellar cortex. J Neurosci. 1999;19:10931–10939. - PMC - PubMed
    1. Boehnke SE, Berg DJ, Marino RA, Itti L, Munoz DP. Adaptation, habituation and dishabituation of visual responses in the superior colliculus. Soc Neurosci Abs. 2007 617.12/PP14.
    1. Burge J, Ernst MO, Banks MS. The statistical determinants of adaptation rate in human reaching. J Vis. 2008;8:1–19. - PMC - PubMed
    1. Catz N, Dicke PW, Thier P. Cerebellar-dependent motor learning is based on pruning a Purkinje cell population response. Proc Natl Acad Sci U S A. 2008;105:7309–7314. - PMC - PubMed
    1. Chen-Harris H, Joiner WM, Ethier V, Zee DS, Shadmehr R. Adaptive control of saccades via internal feedback. J Neurosci. 2008;28:2804–2813. - PMC - PubMed

Publication types

MeSH terms

LinkOut - more resources