. 2009 Oct 14;29(41):13042-52.
doi: 10.1523/JNEUROSCI.2362-09.2009.

gamma-Secretase: successive tripeptide and tetrapeptide release from the transmembrane domain of beta-carboxyl terminal fragment

Affiliations

gamma-Secretase: successive tripeptide and tetrapeptide release from the transmembrane domain of beta-carboxyl terminal fragment

Mako Takami et al. J Neurosci. .

Abstract

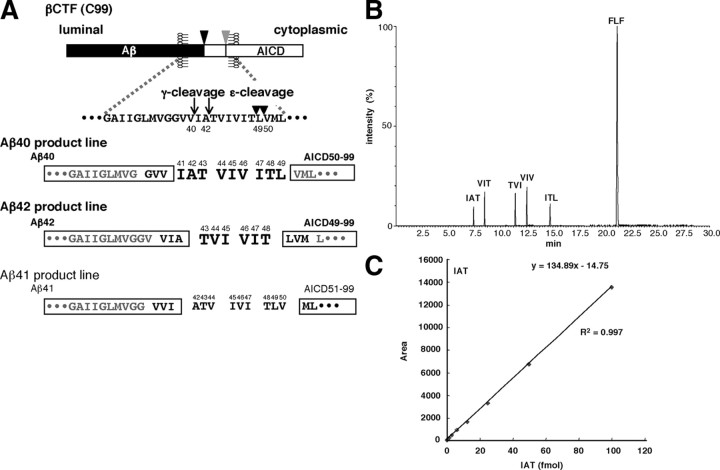
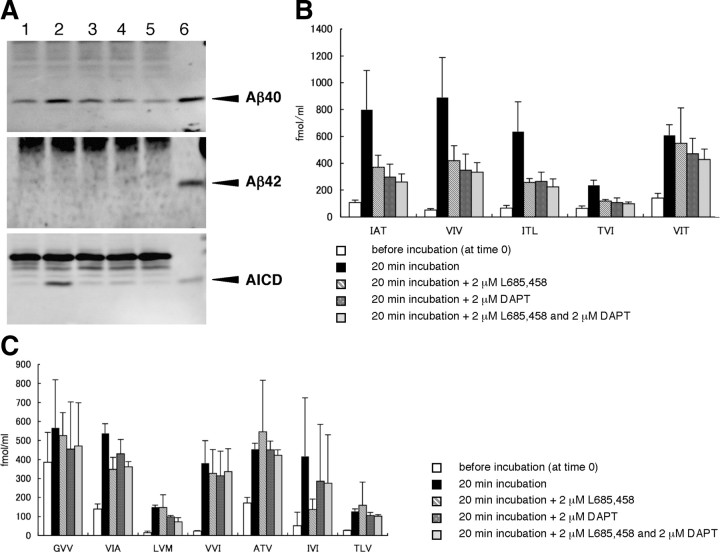
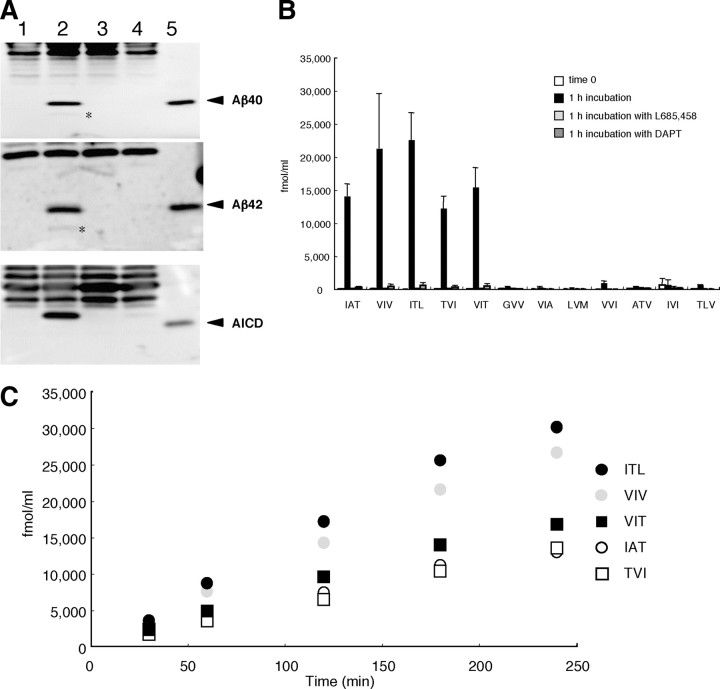
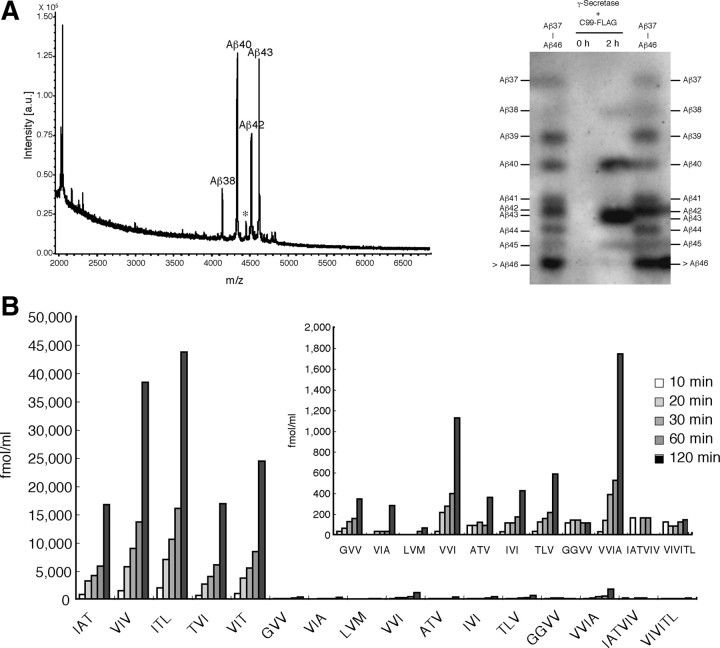
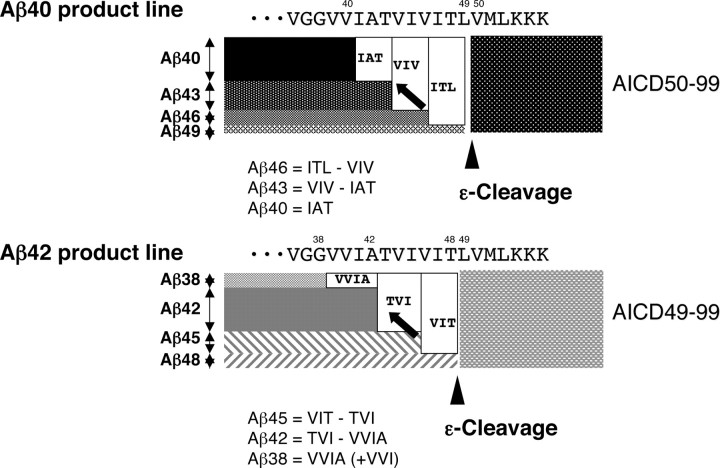
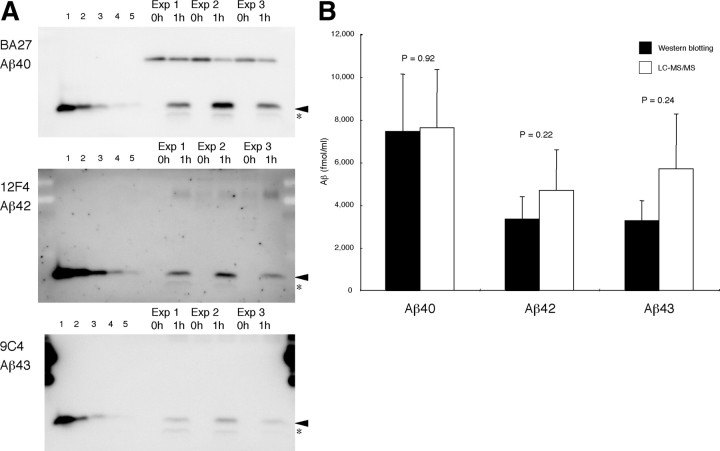
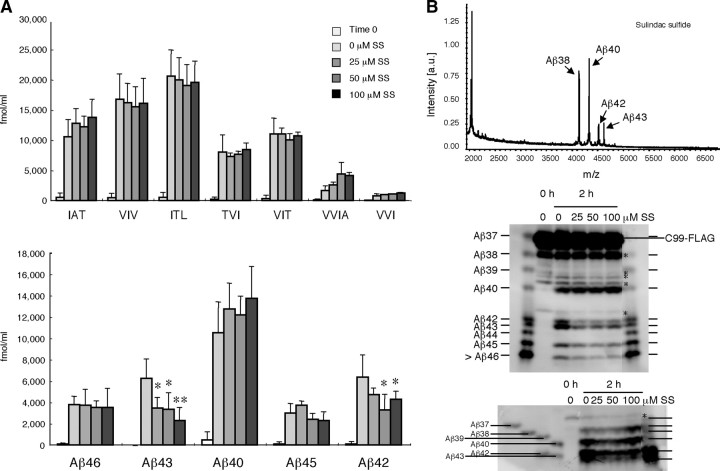
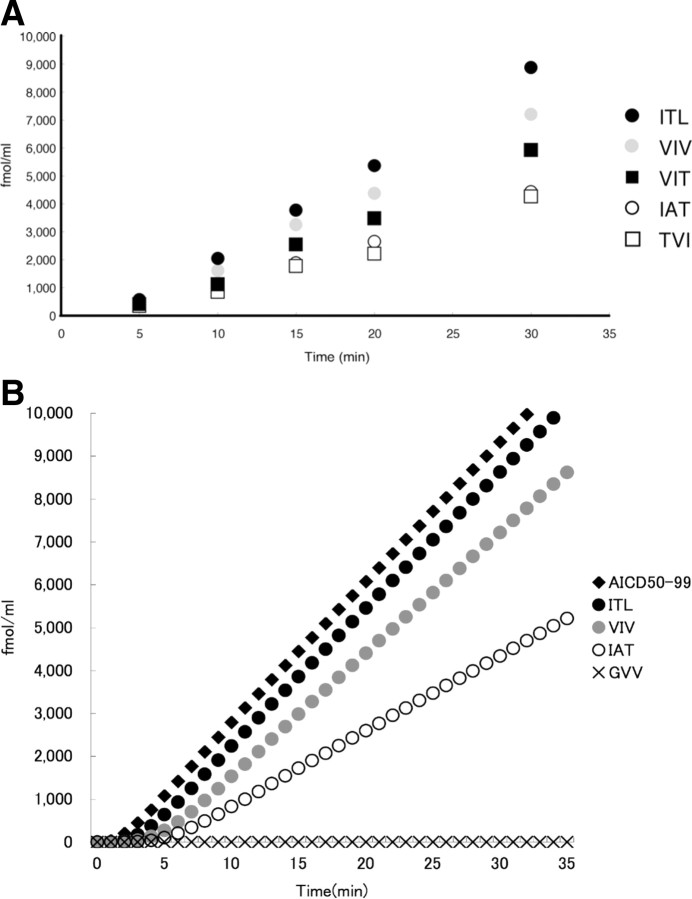
Amyloid beta protein (Abeta), a pathogenic molecule associated with Alzheimer's disease, is produced by gamma-secretase, which cleaves the beta-carboxyl terminal fragment (betaCTF) of beta-amyloid precursor protein in the middle of its transmembrane domain. How the cleavage proceeds within the membrane has long been enigmatic. We hypothesized previously that betaCTF is cleaved first at the membrane-cytoplasm boundary, producing two long Abetas, Abeta(48) and Abeta(49), which are processed further by releasing three residues at each step to produce Abeta(42) and Abeta(40), respectively. To test this hypothesis, we used liquid chromatography tandem mass spectrometry (LC-MS/MS) to quantify the specific tripeptides that are postulated to be released. Using CHAPSO (3-[(3-cholamidopropyl)dimethylammonio]-2-hydroxyl-1-propanesulfonate)-reconstituted gamma-secretase system, we confirmed that Abeta(49) is converted to Abeta(43/40) by successively releasing two or three tripeptides and that Abeta(48) is converted to Abeta(42/38) by successively releasing two tripeptides or these plus an additional tetrapeptide. Most unexpectedly, LC-MS/MS quantification revealed an induction period, 3-4 min, in the generation of peptides. When extrapolated, each time line for each tripeptide appears to intercept the same point on the x-axis. According to numerical simulation based on the successive reaction kinetics, the induction period exists. These results strongly suggest that Abeta is generated through the stepwise processing of betaCTF by gamma-secretase.


Figures

Figure 1.
Figure 1.
Illustration of γ-secretase-mediated successive tripeptide release from βCTF (the tripeptide hypothesis). A, ε-Cleavage at the membrane–cytoplasmic boundary of βCTF (C99) generates Aβ49 and Aβ48 and their counterparts AICD50-99 and AICD49-99 (boxed), respectively. γ-Secretase then successively cleaves in a direction from the ε-cleavage (arrowheads) to γ-cleavage (arrows) sites Aβ49 and Aβ48 by releasing tripeptides at every α-helical turn, finally producing Aβ40 and Aβ42, respectively. Thus, the processing of Aβ49 accompanies the release of ITL, VIV, and IAT in this order, whereas that of Aβ48 accompanies the release of VIT, followed by TVI. Because only two species of AICD50-99 and AICD49-99 have been detected (Sato et al., 2003), the Aβ40 product line starting from Aβ49 and the Aβ42 product line starting from Aβ48 should be predominant. The Aβ41 product line beginning from Aβ50 should be negligible. B, Chromatogram of the five tripeptides (indicated by larger bold letters in A) that are predicted from the tripeptide hypothesis. The authentic tripeptides (12.5 fmol for each) and FLF (100 fmol), an internal control, were subjected to LC-MS/MS (Waters). Each of the five tripeptides and FLF eluted at a distinct position. C, Various concentrations of IAT together with all protease inhibitors that are added to the reaction mixture and FLF were subjected to LC-MS/MS analysis (see Materials and Methods). The resulting peak areas of the product ion were measured and plotted against the IAT concentration, which showed excellent linearity between 0.4 and 100 fmol of IAT (for other peptides, see supplemental Table S1, available at www.jneurosci.org as supplemental material).
Figure 2.
Figure 2.
The tripeptides quantified by LC-MS/MS in the reaction mixture of the cell-free Aβ-generating system. A, The cell-free reaction mixtures before and after incubation were delipidated (see Materials and Methods) and subjected to Western blotting using BA27 (specific for Aβ40), BC05 (specific for Aβ42), and UT18 (to detect AICD) (arrowheads). Small amounts of AICD and especially Aβ40 are associated with the membranes even at time 0 (lane 1), although incubation increased their levels markedly (lane 2). In contrast, in the preparation, Aβ42 was barely detectable at time 0 and even after incubation. There were no additional increases in Aβ40 and AICD in lanes 3 (in the presence of 2 μm L685,458), 4 (in the presence of 2 μm DAPT), and 5 (in the presence of both). Authentic Aβ40, Aβ42, and AICD50-99 (6.3 fmol for each) were loaded in lane 6. B, The five candidate tripeptides predicted to be released were quantified by LC-MS/MS in the cell-free system. Note the following: (1) the significant background noises at time 0; (2) remarkable increases by 20 min incubation in the amounts of tripeptides released; and (3) >50% suppression by γ-secretase inhibitors (2 μm L685,458 and 2 μm DAPT) of IAT, VIV, ITL, and TVI levels. VIT release appeared not to be suppressed significantly by the inhibitors. Data are expressed as the means ± SD (n = 3). Corrections for recoveries were not done (see Materials and Methods). C, Another seven tripeptides aligned on the TMD (from position 39 to position 50 according to Aβ numbering) of βCTF were quantified similarly by LC-MS/MS in the reaction mixture of the cell-free system. Note the following: (1) certain tripeptides gave higher signals at time 0; (2) large increases in their levels by incubation; and (3) no apparent effects on their release by γ-secretase inhibitors. Altogether, the results from the cell-free system may suggest that the tripeptide hypothesis is correct, but, to understand better the cleavage mechanism, the assay system should not be contaminated by proteases. Error bars indicate SD (n = 3). Corrections for recoveries were not done (see Materials and Methods).
Figure 3.
Figure 3.
LC-MS/MS quantification of the tripeptides released in the CHAPSO-reconstituted γ-secretase system. A, The reaction mixture was sampled at time 0 (leftmost lane) and 1 h (the next three lanes) and subjected to SDS-PAGE followed by Western blotting using BA27 (top), BC05 (middle), and UT18 (bottom) (arrowheads). Lane 1, Before incubation (at time 0); lane 2, 1 h incubation; lane 3, 1 h incubation in the presence of 2 μm L685,458; lane 4, 1 h incubation in the presence of 2 μm DAPT; lane 5, authentic Aβ40 (top), Aβ42 (middle), and AICD50-99 (bottom) with 18.8 fmol for each. Barely discernible bands (*) below the Aβ40 or Aβ42 band presumably represent p3 (Aβ17-40 and Aβ17-42; top and middle). AICD in lane 2 (bottom) migrates slower than AICD in lane 5 because of the added FLAG sequence in the former. B, LC-MS/MS quantification of the 12 tripeptides released in the CHAPSO-reconstituted γ-secretase system by 1 h incubation. Note the following: (1) the levels of released tripeptides in the reconstituted system were approximately fivefold higher than in the cell-free system; (2) background noises were very low at time 0 (column 1 for each tripeptide); (3) release of all of the predicted tripeptides was increased markedly by incubation (column 2); (4) release of the tripeptides was blocked completely by 1 μm L685,458 (column 3) or 1 μm DAPT (column 4); and (5) compared with these five tripeptides, the levels of the other seven tripeptides were almost negligible (150 to 1100 the values of the 5 tripeptides). Data are expressed as the means ± SD (n = 3). The recoveries of the tripeptides were assumed to be 49.4% for IAT, 50.4% for VIV, 47.8% for IAT, 48.3% for TVI, 48.4% for VIT, 48.2% for GVV, 48.2% for VIA, 46.8% for LVM, 49.2% for VVI, 50.2% for ATV, 53.2% for IVI, and 48.7% for TLV (see Materials and Methods) (supplemental Table S2, available at www.jneurosci.org as supplemental material). C, Aliquots were taken from the reaction mixture at the times indicated and subjected to LC-MS/MS analysis. The release reactions proceeded linearly up to ∼1 h and then declined gradually. The relationships ITL > VIV > IAT and VIT > TVI were maintained throughout. Corrections for the recoveries were the same as above. Black circles, ITL; gray circles, VIV; white circles, IAT; black squares, VIT; white squares, TVI.
Figure 4.
Figure 4.
The successive cleavage by the CHAPSO-reconstituted system produces finally Aβ40 and Aβ38 but not smaller Aβs. A, Left, The reaction mixture after 1 h incubation was immunoprecipitated with 82E1, and the precipitate was subjected to TOF mass spectrometry. Four distinct peaks were identified, and their m/z values corresponded to those of Aβ38, Aβ40, Aβ42, and Aβ43. A small peak indicated by * that is located between the Aβ40 and Aβ42 peaks may not be Aβ41 judging from the observed m/z. Right, 82E1 Western blotting after modified urea/SDS-PAGE, which prevented superimposition of βCTF on Aβs so that Aβs as small as Aβ37 were identified. The reaction mixture after 2 h incubation contained Aβ45 and longer species, Aβ43, Aβ42, Aβ40, and Aβ38, but not Aβ37 (lane 3), a finding that was consistent with the results of TOF mass spectrometry. Aβ42/43 were not well separated under the conditions (lanes 3, 4). Combined authentic Aβ37–Aβ49 were loaded in the leftmost and rightmost lanes. B, The reaction mixture was sampled at 10 min to 2 h and subjected to LC-MS/MS analysis. The levels of the five tripeptides increased markedly in a time-dependent manner. The levels of VVI and VVIA also increased significantly. The levels of other tripeptides, including GVV, VIA, ATV, IVI, and TLV, show very small increases (inset), and the levels of GGVV, IATVIV, and VIVITL did not change after incubation up to 2 h. The recoveries of the 12 tripeptides were the same as above, and those of the tetrapeptides and hexapeptides were assumed to be 52.8% for GGVV, 54.3% for VVIA, 46.7% for IATVIV, and 73.1% for VIVITL (see the legend to Fig. 3 and supplemental Table S2, available at www.jneurosci.org as supplemental material).
Figure 5.
Figure 5.
Illustration of the stepwise processing of βCTF. Aβ40 product line: Aβ49 generated by ε-cleavage (arrowhead) is processed successively probably on the γ-secretase complex. Aβ49 is converted to Aβ46 by releasing ITL, and Aβ46 is converted to Aβ43 by releasing VIV. Finally, Aβ43 is converted to Aβ40 by releasing IAT (arrow). The characteristic of this model is that the difference in the amounts of tripeptide released determines the amount of Aβ produced. Accordingly, Aβ46 = ITL − VIV, Aβ43 = VIV − IAT, and Aβ40 = IAT. Aβ42 product line: Aβ48 generated by ε-cleavage (arrowhead) is converted to Aβ45, and Aβ45 in turn is converted to Aβ42. Aβ42 is converted finally to Aβ38 (arrow). Similarly, Aβ45 = VIT − TVI, Aβ42 = TVI − VVIA, and Aβ38 = VVIA (see Results). The final step in the Aβ42 product line is removal of VVIA, instead of VIA.
Figure 6.
Figure 6.
Quantitative comparisons between Western blotting and LC-MS/MS. Three experiments were performed using the same lot of substrate (250 nm C99–FLAG) and the same CHAPSO-solubilized supernatant for immunoprecipitation. One-half of the aliquots taken from the reaction mixture was subjected to conventional PAGE, and the other half was treated with TCA and subjected to LC-MS/MS to quantify the tripeptides. A, The left five lanes in each panel were for the standards: 2.5, 5, 12.5, 25, and 50 fmol of each authentic Aβ was loaded in lanes 1–5 and subjected to quantitative Western blotting with BA27 for Aβ40 (top), with 12F4 (middle) for Aβ42, and with 9C4 (bottom) for Aβ43. The samples before and after 1 h incubation were loaded in the right six lanes. The reaction mixture generated significant levels of Aβ40, Aβ42, or Aβ43 after 1 h incubation (arrowheads). Barely discernible bands indicated by * may represent p3 (Aβ17-40 and Aβ17-42). B, Quantification of generated Aβ40, Aβ42, and Aβ43 by Western blotting (black column) and by LC-MS/MS based on the stepwise-processing model (white column). Data are expressed as the means ± SD (n = 3). The recoveries for Aβs were assumed to be 85.6% for Aβ40, 80.7% for Aβ42, and 84.6% for Aβ43 (supplemental Table S3, available at www.jneurosci.org as supplemental material). No significant difference (p = 0.92 for Aβ40, 0.22 for Aβ42, and 0.24 for Aβ43, t test) between Western blotting and LC-MS/MS data.
Figure 7.
Figure 7.
The effects of sulindac sulfide on the stepwise processing. The reaction mixture containing 0, 25, 50, or 100 μm sulindac sulfide was incubated and sampled at 2 h for LC-MS/MS analysis. A, The levels of tripeptides and tetrapeptides release (top) and the calculated levels of Aβs according to the stepwise-processing model (bottom). Data are expressed as the means ± SD (n = 3). The levels of released tripeptides did not change significantly, whereas the level of VVIA tended to increase (although not significantly) with increasing concentrations of sulindac sulfide. Calculated levels of Aβ42 and Aβ43 were suppressed significantly by sulindac sulfide (*p < 0.05; **p < 0.01, ANOVA with Bonferroni's post hoc test compared with no treatment). In contrast, the levels of other Aβs, including Aβ40, Aβ45, and Aβ46, did not change significantly. The corrections for the peptides were the same as above (see the legends to Figs. 3, 4). B, Aliquots from the reaction mixture incubated with or without sulindac sulfide (100 μm) were immunoprecipitated with 82E1, and the precipitate was subjected to TOF mass spectrometry (top) and urea/SDS-PAGE [11% acrylamide gel (middle) and 20/10% discontinuous acrylamide gel (bottom)], followed by Western blotting with 82E1. TOF mass spectrometry shows that peak heights of Aβ42 and Aβ43 relative to that of Aβ40 decreased compared with those without sulindac sulfide treatment (see Fig. 4 A). The peak height of Aβ38 relative to that of Aβ40 increased substantially after the treatment (see Fig. 4 A). Western blotting (middle and bottom) showed that (1) Aβ40 stayed at a similar level, (2) Aβ42 and Aβ43 decreased markedly (middle), (3) Aβ38 increased (bottom), and (4) Aβ45 decreased somewhat (middle). Under the present conditions (middle), Aβs longer than Aβ45 were stuck at the buffer front. * indicates C-terminally truncated C99–FLAG in middle and bottom panels. Overall, the data on the effects of sulindac sulfide based on LC-MS/MS quantification of tripeptides and tetrapeptides corresponded well with those from TOF mass spectrometry and those from quantitative Aβ Western blotting.
Figure 8.
Figure 8.
A, The very early phase of the tripeptide-release reaction. The reaction mixture was sampled at 5–30 min and subjected to LC-MS/MS analysis for tripeptide quantification. Approximately 245 μl of 0.25% CHAPSO buffer containing 0.1% phosphatidylcholine was preincubated at 37°C. The CHAPSO buffer that was kept at 37°C was added to the γ-secretase-bound protein A-Sepharose (∼20 μl) in an Eppendorf tube that had been kept on ice, and the mixture was incubated at 37°C for 5 min. The reaction was started by addition of the substrate, C99–FLAG (∼5 μl) that had been kept on ice, and the reaction mixture continued with agitation in a chamber kept at 37°C. Extrapolation of each time line for each tripeptide appears to intercept the same point on the x-axis, indicating that the reactions start after a 3–4 min induction period. The corrections for the peptides were the same as above (see the legends to Figs. 3, 4). Note that the relationships ITL > VIV > IAT and VIT > TVI were maintained up to 10 min. Black circles, ITL; gray circles, VIV; white circles, IAT; black squares, VIT; white squares, TVI. B, Tripeptide-release kinetics simulated based on the stepwise-processing model. A set of parameters were optimized using genetic algorithm to fit the experimental data in Figure 8 A (supplemental Table S4, available at www.jneurosci.org as supplemental material). The simulation shows that there are induction periods for the generation of AICD50-99 as well as for that of tripeptides. After induction periods, 3–4 min for tripeptides and ∼2 min for AICD49-99, the reactions proceeded in a linear manner up to 6 h (data not shown).

References

    1. Beher D, Wrigley JD, Owens AP, Shearman MS. Generation of C-terminally truncated amyloid-β peptides is dependent on γ-secretase activity. J Neurochem. 2002;82:563–575. - PubMed
    1. Eriksen JL, Sagi SA, Smith TE, Weggen S, Das P, McLendon DC, Ozols VV, Jessing KW, Zavitz KH, Koo EH, Golde TE. NSAIDs and enantiomers of flurbiprofen target γ-secretase and lower Aβ 42 in vivo. J Clin Invest. 2003;112:440–449. - PMC - PubMed
    1. Funamoto S, Morishima-Kawashima M, Tanimura Y, Hirotani N, Saido TC, Ihara Y. Truncated carboxyl-terminal fragments of β-amyloid precursor protein are processed to amyloid β-proteins 40 and 42. Biochemistry. 2004;43:13532–13540. - PubMed
    1. Iwatsubo T, Odaka A, Suzuki N, Mizusawa H, Nukina N, Ihara Y. Visualization of Aβ 42(43) and Aβ 40 in senile plaques with end-specific Aβ monoclonals: evidence that an initially deposited species is Aβ 42(43) Neuron. 1994;13:45–53. - PubMed
    1. Kakuda N, Funamoto S, Yagishita S, Takami M, Osawa S, Dohmae N, Ihara Y. Equimolar production of amyloid β-protein and amyloid precursor protein intracellular domain from β-carboxyl-terminal fragment by γ-secretase. J Biol Chem. 2006;281:14776–14786. - PubMed

Publication types

MeSH terms

LinkOut - more resources