Review
. 2009 Oct 15;461(7266):908-15.
doi: 10.1038/nature08537.

Neuroscience in the era of functional genomics and systems biology

Affiliations
Review

Neuroscience in the era of functional genomics and systems biology

Daniel H Geschwind et al. Nature. .

Abstract

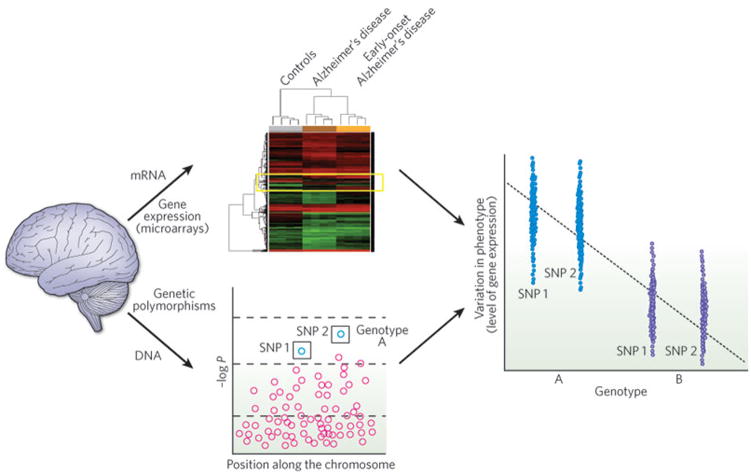
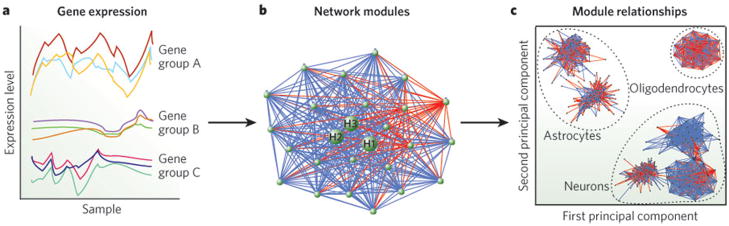
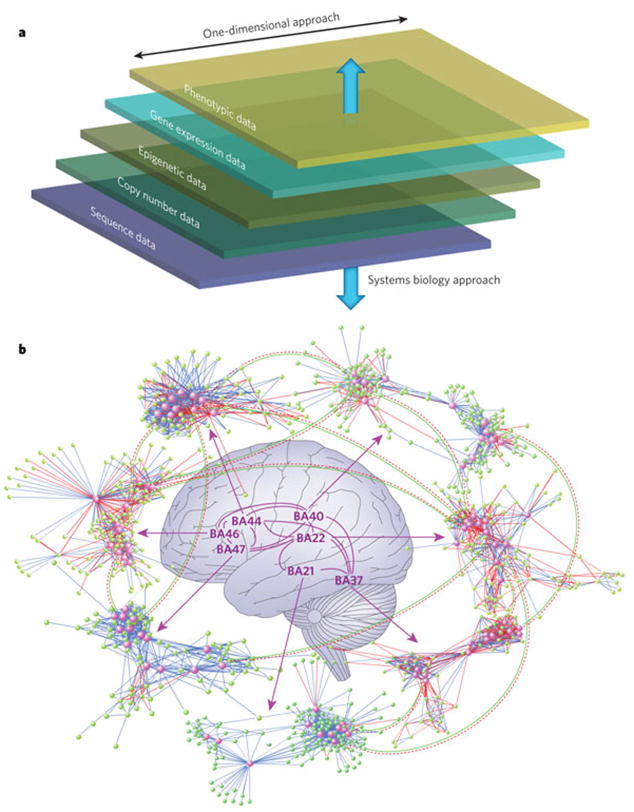
Advances in genetics and genomics have fuelled a revolution in discovery-based, or hypothesis-generating, research that provides a powerful complement to the more directly hypothesis-driven molecular, cellular and systems neuroscience. Genetic and functional genomic studies have already yielded important insights into neuronal diversity and function, as well as disease. One of the most exciting and challenging frontiers in neuroscience involves harnessing the power of large-scale genetic, genomic and phenotypic data sets, and the development of tools for data integration and mining. Methods for network analysis and systems biology offer the promise of integrating these multiple levels of data, connecting molecular pathways to nervous system function.


Figures

Figure 1
Figure 1. Correlating genetic polymorphism and gene expression data
Investigation of whole-genome single-nucleotide polymorphism (SNP) data from different phenotypic subgroups is typically used to perform genetic association based on diagnostic categories such as dementia. By treating gene expression data as a quantitative phenotype for genetic association, these two data sets can be combined to identify genetic loci that control quantitative variation in gene expression (which are known as eQTLs). Here, an analysis of mRNA and DNA from three types of brain sample (healthy individuals, patients with Alzheimer’s disease and those with early-onset Alzheimer’s disease) is depicted. The heat map (centre top) depicts the expression levels of all genes as determined by microarray analysis. The yellow box highlights genes with expression variations across the patient groups. The plot beneath shows DNA data from the same patients assessed for genetic polymorphisms (negative logarithm of the P value versus position on a chromosome); two SNPs (1 and 2) are found to correlate with a subset of patients (genotype A). Combining these data (right), the different genotypes are found to correlate with differences in gene expression.
Figure 2
Figure 2. WGCNA schematic
The underlying structure of a molecular network can be identified from high-dimensionality data sets such as those obtained from proteomic techniques or microarrays. This network structure can be used to guide research. a, Co-expression of groups of molecules across samples is measured to build networks, which comprise highly related clusters, or modules (for instance gene groups A, B and C here). b, A network module displaying the interconnection of genes. A gene’s position within the network has significant functional implications. Hub genes are the most connected, or central, genes within each module (depicted here as H1, H2 and H3). Each gene is depicted as a green node; blue lines indicate positive correlations; and red lines indicate negative correlations. c, The multidimensional scaling plot of the first and second principal components of all of the modules in a network demonstrates the meta-module structure, which clusters into functional groups such as, in this example, different central-nervous-system cell subtypes.
Figure 3
Figure 3. The systems biology approach to high-dimensional data sets allows integration of multiple layers of data
a, The traditional experimental approach to the complexity of neuronal systems and diseases usually stretches across one or two layers of information. Typically, efforts are directed towards genetic data (such as sequence variants and epigenetic modifications), genomic data (such as gene expression) or phenotypic data (such as electrophysiological and clinical data). The systems biology approach seeks to consider all of these aspects at the same time, through the creation of comprehensive relational databases. The identification of a higher structure in high-dimensional data sets (for example by using network methods) facilitates the connection between different types of information (for example between genetic data and genomic data). b, Illustration of a potential systems-level integration of regional brain gene expression, coupled with network-based analysis methods and imaging data, to provide insights into brain connectivity. This is a stylized visualization of the combination of diffusion tensor imaging data for language areas with gene expression and WGCNA analysis to reveal integration of gene co-expression across brain areas (BA, Brodmann area), as well as novel brain-region wiring. The green lines and dashed red lines indicate information flow in both directions and can be extrapolated to suggest excitatory and inhibitory interconnections. The integration of network analysis, gene expression data and imaging analysis will elucidate the relationships among key genetic drivers in distinct regions and their relationship to brain regional connectivity in normal conditions and in disease. Each gene is depicted as a node (green or pink), with hub genes represented by pink nodes. Blue lines indicate positive correlations, and red lines indicate negative correlations. Lines between Brodmann areas indicate real and potential interactions through white-matter tracts.

References

    1. Coppola G, Geschwind DH. Microarrays and the microscope: balancing throughput with resolution. J Physiol (Lond) 2006;575:353–359. - PMC - PubMed
    1. Nelson SB, Hempel C, Sugino K. Probing the transcriptome of neuronal cell types. Curr Opin Neurobiol. 2006;16:571–576. - PubMed
    1. Mirnics K, Pevsner J. Progress in the use of microarray technology to study the neurobiology of disease. Nature Neurosci. 2004;7:434–439. - PubMed
    1. Geschwind DH. Mice, microarrays, and the genetic diversity of the brain. Proc Natl Acad Sci USA. 2000;97:10676–10678. - PMC - PubMed
    1. Hood L, Heath JR, Phelps ME, Lin B. Systems biology and new technologies enable predictive and preventative medicine. Science. 2004;306:640–643. - PubMed

Publication types