

Review
doi: 10.1038/nature08538.
Multimodal techniques for diagnosis and prognosis of Alzheimer's disease
Affiliations
- PMID: 19829371
- PMCID: PMC2810658
- DOI: 10.1038/nature08538
Item in Clipboard
Review
Multimodal techniques for diagnosis and prognosis of Alzheimer's disease
Nature.
.
Abstract
Alzheimer's disease affects millions of people around the world. Currently, there are no treatments that prevent or slow the disease. Like other neurodegenerative diseases, Alzheimer's disease is characterized by protein misfolding in the brain. This process and the associated brain damage begin years before the substantial neurodegeneration that accompanies dementia. Studies using new neuroimaging techniques and fluid biomarkers suggest that Alzheimer's disease pathology can be detected preclinically. These advances should allow the design of new clinical trials and early mechanism-based therapeutic intervention.
Figures
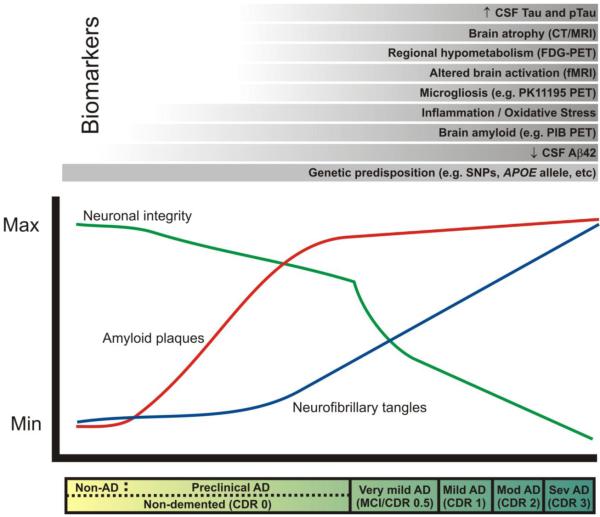
The clinical stages of AD, marked by progressive dementia described as ‘very mild/mild cognitive impairment’ (MCI), ‘mild,’ ‘moderate,’ and ‘severe,’ correspond with Clinical Dementia Rating (CDR) scores of 0.5, 1, 2, and 3, respectively (see bar below plot). These stages are associated with abundant amyloid plaques (red line), the gradual accumulation of neurofibrillary tangles (blue line), synaptic and neuronal loss in certain brain regions (green line). In the ‘preclinical’ stage of AD, Aβ42 peptide forms amyloid plaques in the brains of non-demented individuals (CDR 0) for approximately 10-15 years, and damages neuronal processes and synapses. Eventually, dramatic neuronal losses occur in association with dementia onset. AD biomarker research seeks to measure changes in the structure and function of the brain (e.g. atrophy, regional activity changes and hypometabolism, amyloid plaque and NFT formation, microgliosis, inflammation, oxidative stress) that might be useful for diagnosis and prognosis during this ‘preclinical’ phase of AD, before irreversible neuronal loss occurs. These changes can be measured by radiological imaging modalities (e.g. computed tomography [CT], magnetic resonance imaging [MRI], functional magnetic resonance imaging [fMRI], and positron emission tomography [PET] with various imaging contrast agents) and/or by biochemical examination of cerebrospinal fluid (CSF). The most promising biomarkers to date are listed above the plot in chronological order from bottom to top according to the earliest stage of the pathological process at which they seem to show utility. A reduced concentration of CSF Aβ42 may provide the earliest definitive evidence of AD pathology in the brain. Genetic variations (e.g. single nucleotide polymorphisms [SNPs]) may also be considered biomarkers that allow the earliest possible estimation of risk. PIB, Pittsburgh compound B. (Modified, with permission, from Craig-Schapiro R., et al., Biomarkers of Alzheimer’s Disease, Neurobiol. Dis., 2009;35(2):128-140).
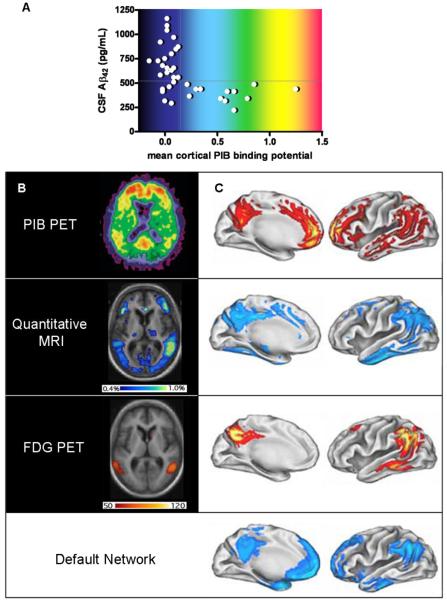
A, Relationship of PIB PET to CSF Aβ42 levels in cognitively normal individuals. Subjects with mean cortical PIB binding potentials > 0.16 (calculated from an average of PIB retention in the prefrontal cortex, the lateral temporal cortex, the precuneus and the gyrus rectus, divided by PIB retention in the cerebellar cortex) are considered ‘positive’ and uniformly have low CSF Aβ42 (<500pg/mL); PIB ‘negative’ subjects with low Aβ42 may have non-fibrillar (diffuse) Aβ42 deposits that do not retain PIB; whether this latter group will be more likely to develop dementia than PIB ‘negative’ subjects with high CSF Aβ42 is not yet known. B, Axial (horizontal) view of AD brain, imaged to quantify amyloid (PIB PET, above), annual rates of regional atrophy (Quantitative MRI, middle), and hypometabolism (FDG PET, below) in relation to disease severity. The intensity of the PIB binding potential is depicted using a color scale (approximated by the colors in A) in which red reflects greatest PIB retention, and black and dark blue reflect least PIB retention. The regional extent of atrophy is depicted colorimetrically, with rates ranging from 0.4% per year (dark blue) to 1% per year (yellow/green). Regional hypometabolism is also depicted colorimetrically, with red and yellow representing greater and lesser hypometabolism, respectively. The units of this scale reflect the slope of the regression between hypometabolism and dementia severity as measured by mini mental status examination; high slope suggests a steeper decline in metabolism in relation to decreasing cognitive ability. C, Illustrations of left hemi-brain surfaces (medial, left; lateral, right), allowing comparison of averaged anatomic signal maps for amyloid (top), atrophy (second from top), hypometabolism (third from top), and ‘default network’ activity (bottom). Regional amyloid load (PIB binding potential) is depicted as percentage increase of PIB binding potential over that of the brainstem, ranging from 5% (red) to 40% (yellow/white). Colorimetric scales for atrophy and hypometabolism are as in B. The color scale for regional default-network activity shows the degree of association, ranging from greatest association with default-network activity (light blue) to least statistically significant association (darker blue). (Panels A and B [top view]: modified, with permission, from ref. .; panels B [remaining views] and C: modified, with permission, from ref. 27).
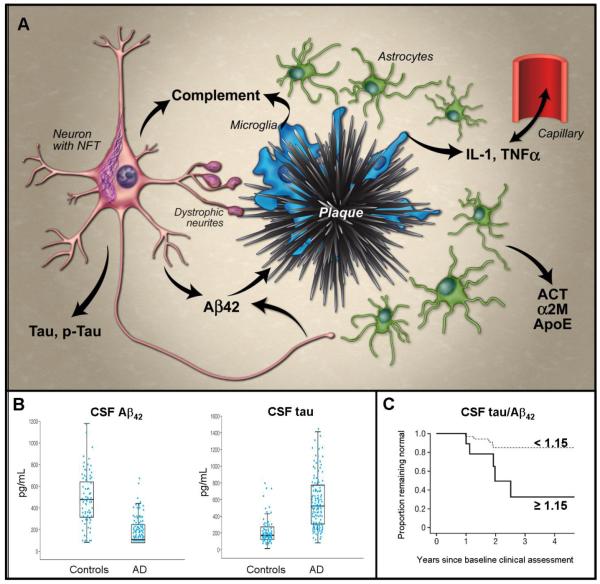
A, Abridged schematic histological representation of fluid biomarkers in relation to AD pathology. Produced by neurons, Aβ42 becomes deposited in plaques, which activate microglia. Microglia release cytokines (e.g. IL-1β, TNFα) that appear to cross the blood brain barrier and also activate astrocytes, inducing production of α-1-antichymotrypsin (ACT) and α-2-macroglobulin (α2M). Microglia and neurons also produce complement factors that can be activated by Aβ aggregates, and cause synapse loss. Tau becomes hyperphosphorylated and aggregates into neurofibrillary tangles (NFT) in neurons and dystrophic neurites around plaques; its mechanism of release from neurons is uncertain. Lipid peroxidation in neurons leads to isoprostane formation (not shown). Most factors entering the extracellular space migrate into the CSF; Aβ42 preferentially partitions into plaques. B, Representative data demonstrating utility of CSF levels of Aβ42 (left) and tau (right) to distinguish groups of AD subjects and age-matched controls – boxes represent 25th, 50th and 75th percentiles of the data; length of box is interquartile range; lower and upper whiskers represent the 25th and, respectively, 75th percentiles plus or minus 1.5 times the interquartile range. (Reproduced, with permission, from Sunderland, T., et al., Decreased beta-amyloid1-42 and increased tau levels in cerebrospinal fluid of patients with Alzheimer disease. JAMA. 289,2094-2103 (2003)). C, Ratio of CSF levels of tau and Aβ42 as predictors of conversion from cognitive normalcy to MCI/dementia using Kaplan-Meier estimates of rates of conversion with a cut-off value of 1.15 (representing the top 15% of distribution values). More than 80% of subjects with low tau and high Aβ42 (tau/ Aβ42 < 1.15; dashed line) remain cognitively normal four years after baseline assessment; among those with high tau and low Aβ42 (tau/ Aβ42 ≥ 1.15; solid line), approximately 30% remain cognitively normal. (Reproduced, with permission, from ref. 38).
References
-
- Alzheimer A. (Translated by Jarvik, L.a.G., H.). ber eine eignartige Erkrankung der Hirnrinde. (About a peculiar disease of the cerebral cortex.) Alzheimer Dis. Assoc. Disorders. 1987;1:7–8. - PubMed
-
- Khachaturian ZS. Diagnosis of Alzheimer’s disease. Arch Neurol. 1985;42:1097–105. - PubMed
-
- Mirra SS, et al. The Consortium to Establish a Registry for Alzheimer’s Disease (CERAD) Part II. Standardization of the neuropathologic assessment of Alzheimer’s disease. Neurology. 1991;41:479–86. - PubMed
-
- Hyman BT, Trojanowski JQ. Consensus recommendations for the postmortem diagnosis of Alzheimer disease from the National Institute on Aging and the Reagan Institute Working Group on diagnostic criteria for the neuropathological assessment of Alzheimer disease. J Neuropathol Exp Neurol. 1997;56:1095–7. - PubMed
-
- Crystal H, et al. Clinico-pathologic studies in dementia: nondemented subjects with pathologically confirmed Alzheimer’s disease. Neurology. 1988;38:1682–7. - PubMed
Publication types
MeSH terms
Substances
Grants and funding
LinkOut - more resources
Full Text Sources
Other Literature Sources
Medical
