. 2009 Oct 15;461(7266):941-6.
doi: 10.1038/nature08499.

Intracellular dynamics of hippocampal place cells during virtual navigation

Affiliations

Intracellular dynamics of hippocampal place cells during virtual navigation

Christopher D Harvey et al. Nature. .

Abstract

Hippocampal place cells encode spatial information in rate and temporal codes. To examine the mechanisms underlying hippocampal coding, here we measured the intracellular dynamics of place cells by combining in vivo whole-cell recordings with a virtual-reality system. Head-restrained mice, running on a spherical treadmill, interacted with a computer-generated visual environment to perform spatial behaviours. Robust place-cell activity was present during movement along a virtual linear track. From whole-cell recordings, we identified three subthreshold signatures of place fields: an asymmetric ramp-like depolarization of the baseline membrane potential, an increase in the amplitude of intracellular theta oscillations, and a phase precession of the intracellular theta oscillation relative to the extracellularly recorded theta rhythm. These intracellular dynamics underlie the primary features of place-cell rate and temporal codes. The virtual-reality system developed here will enable new experimental approaches to study the neural circuits underlying navigation.


Figures

Figure 1
Figure 1. Predicted and measured subthreshold membrane potential dynamics during a run through a cell’s place field
(A)Schematic of a place cell’s firing rate during a run through its place field. All predicted and measured subthreshold membrane potential traces are aligned to the firing rate plot. (B)Schematic of predicted subthreshold membrane potential dynamics from a dual oscillator interference model,. In this model, place cells receive two steady sets of rhythmic inputs occurring at different frequencies in the theta band. The interference between these oscillations results in a beat-like pattern of membrane potential fluctuations with the positive phase of the beat wave defining the place field. Note that the schematics in (B–E) only illustrate depolarizations and changes in theta amplitude. (C)Schematic of predicted subthreshold membrane potential dynamics from a modified dual oscillator model. Outside the place field, the two oscillations are 180° out of phase. Upon entering the place field, the frequency of one oscillation increases, resulting in a modulation of the summed oscillation. (D)Schematic of predicted subthreshold membrane potential dynamics from a soma-dendritic interference model,,,. In this model, the cell receives somatic inhibitory inputs and dendritic excitatory inputs, both at theta frequencies. In the place field, the excitatory drive increases, which is apparent as a ramp-like depolarization and an increase in the amplitude of excitatory theta oscillations. Depending on the conductances used in the model, the summed oscillation can have either increased (gray) or decreased (black) amplitude. (E) Schematic of predicted ramps of depolarization of the baseline membrane potential. In a network model, the cell receives a place-related, symmetric ramp-like excitatory drive and inputs from neuronal assemblies with nearby place fields–. Another model proposes an asymmetric ramp of depolarization to combine rate and temporal codes. Both models incorporate a steady membrane potential theta oscillation. (F) Example of a subthreshold membrane potential recorded intracellularly from a place cell in a virtual environment. The membrane potential trace was filtered from DC-10 Hz, after spikes were removed, to illustrate the simultaneous occurrence of a ramp of depolarization and an increase in theta oscillation amplitude. The scale bars refer to the experimentally measured trace only. (G)Schematic of the LFP theta rhythm. Peaks are marked by gray dashed lines. (H)Schematic of a predicted relationship between intracellular theta and LFP theta to account for phase precession of spikes relative to LFP theta oscillations. Intracellular and LFP theta are the same frequency. Phase precession of spikes (black lines) occurs relative to both intracellular and LFP theta due to a ramp of depolarization–,. An asymmetric ramp is shown. Note that the schematics in (H-I) are meant to illustrate only the relationships between spike times, intracellular theta, and LFP theta. (I) Schematic of a predicted membrane potential trace in which intracellular theta is a higher frequency than LFP theta in the place field, resulting in phase precession of spikes relative to LFP theta but not intracellular theta,,,,–.
Figure 2
Figure 2. Spatial behaviors in a virtual reality environment
(A) Schematic of the experimental set-up. A head-restrained mouse runs on an air-supported spherical treadmill. An image from a DLP projector is displayed on a toroidal screen (−20 to +60 degrees vertically, 270 degrees horizontally) via a reflecting mirror (rm) and an angular amplification mirror (aam). Movements of the treadmill are measured using an optical computer mouse. Water rewards are delivered through a lick tube via a computer-controlled solenoid valve. See Methods and Supplementary Fig. 1 for details. (B) The virtual linear track. Screenshots (without the fisheye perspective, see Methods) from the right and left ends of the track are shown. The track (180 cm × 9 cm) was divided into three regions with different textures on the proximal walls (black dots, vertical stripes, white dots). Distal walls (horizontal stripes, green with black crosses) were present at the boundaries between regions. Water rewards were given at the ends of the track, with available rewards alternating between reward sites. (C) Example trajectories for an individual mouse on training sessions 4 and 10. Position is the animal’s location along the track’s long axis. Blue dots indicate rewards. (D) Rate of rewards for individual mice (gray lines). The black line indicates the mean. n = 7 mice. (E) Average distance traveled by the mouse between consecutive rewards. Gray lines indicate individual mice, and the black line is the mean. n = 7 mice.
Figure 3
Figure 3. Extracellular recordings of CA1 place cells along the virtual linear track
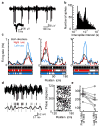
(A) An example extracellular recording filtered between 500 Hz and 7.5 kHz. The inset shows overlaid spike waveforms from the recording. (B) ISI distribution for the full duration of the recording shown in (A). The time axis is plotted on a log scale. (C) Example firing rate maps for 3 place cells from 3 different mice. Top, Firing rates at positions along the track are shown for rightward runs (red), leftward runs (blue), and runs in either direction (black). Bottom, The position on the track of each spike in the recording is shown as a vertical line. A total of 23 place cells from 8 mice were recorded. (D) Phase precession of spike times relative to LFP theta. Top left, An example extracellular recording, filtered between 2 Hz and 10 kHz, during a run through the place field. Spikes and the LFP were recorded on the same electrode. Bottom left, The extracellular recording band-pass filtered between 6–10 Hz. Gray lines indicate peaks (0 degrees) in the filtered trace, and black lines indicate the times of spikes. Right, An example plot of phase (two cycles) vs. position on the virtual track for all spikes during complete runs through the place field for a single cell. (E) Phase values for spikes in the first eighth and last eighth of the place field. Connected points represent a single place field. Horizontal lines indicate the means. n = 10 place fields from 8 cells and 3 mice (multiple place fields are due to the directionality of firing rates).
Figure 4
Figure 4. Ramp-like membrane potential depolarization inside place fields
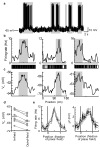
(A) Example whole cell recording during runs through the cell’s place field. Gray boxes indicate the place field (middle example from (B)). (B) Firing rates along the virtual linear track for 3 place cells recorded intracellularly from 3 different animals. The gray boxes indicate the primary place field determined by firing rates (Methods). Bottom, vertical lines mark the location along the track of every action potential in the recording. (C) Average baseline membrane potential, excluding action potentials, sorted by position along the track for the three place cells from (B). (D) Average membrane potential inside and outside the place field. Each pair of connected points is from a single cell. Horizontal lines indicate the means. n = 8 cells from 8 mice. (E) Average firing rates and changes in baseline membrane potential during complete runs through the place field. To combine data from multiple cells, position values in the place field were normalized. Black lines indicate the mean. Gray lines indicate the mean ± sem. Data are averaged over 84 complete runs through the place field (8 cells).
Figure 5
Figure 5. Membrane potential theta oscillations in place cells
(A) Top, Example whole cell recording during runs through the cell’s place field. The band-pass (6–10 Hz) filtered version of the same trace, excluding action potentials, is also shown. Gray boxes indicate the place field (left example from Fig. 4B). Bottom, Expanded portions of the raw and filtered traces taken from the segments at the base of the arrows. (B) Power in the theta-frequency band sorted by position along the track for the whole cell recordings from Fig. 4. Power was measured as the squared amplitude of the filtered membrane potential trace. Gray boxes indicate the primary place fields. (C) Theta power inside and outside the place field. Each pair of points represents a single cell. Horizontal bars indicate means. n = 8 cells from 8 mice. (D) Measurement of spike times relative to intracellular theta. Top left, Example membrane potential trace during a run through the place field. Bottom left, The membrane potential filtered between 6–10 Hz. Gray lines indicate the peaks of theta oscillations (0 degrees). Blacks lines indicate the times of spikes. The vertical scale bar for the unfiltered and filtered trace indicates 20 mV and 10 mV, respectively. Right, Example phase (two cycles) vs. position plot for all spikes during complete runs through a place field for a single cell. (E) Intracellular phase values for spikes in the first eighth and last eighth of the place field. Each set of connected points indicates a single place field. Black lines indicate the means. n = 12 place fields and 8 cells from 8 mice. (F) Simultaneous LFP and whole cell recordings. Left, membrane potential and LFP traces during a run through the cell’s place field. Right, Filtered (6–10 Hz) membrane potential and LFP traces. The times of LFP theta peaks (gray lines), intracellular theta peaks (circles), and spikes (crosses) are shown to illustrate the phase precession of spikes and intracellular theta relative to LFP theta oscillations and the absence of phase precession of spikes relative to intracellular theta oscillations. Top and bottom scale bar labels correspond to the top and bottom traces, respectively. (G) Phase precession analysis from a simultaneous LFP and whole cell recording during runs through the place field. Left, Analysis of phase precession of spike times relative to intracellular theta. Middle, Phase precession of spike times relative to LFP theta. Right, Phase precession of intracellular theta peak times relative to LFP theta. Position values are positions on the virtual track.

Comment in

References

    1. Moser EI, Kropff E, Moser MB. Place Cells, Grid Cells, and the Brain’s Spatial Representation System. Annu Rev Neurosci. 2008;31:69–89. - PubMed
    1. O’Keefe J, Burgess N. Dual phase and rate coding in hippocampal place cells: theoretical significance and relationship to entorhinal grid cells. Hippocampus. 2005;15:853–866. - PMC - PubMed
    1. O’Keefe J, Dostrovsky J. The hippocampus as a spatial map. Preliminary evidence from unit activity in the freely-moving rat. Brain Res. 1971;34:171–175. - PubMed
    1. O’Keefe J, Recce ML. Phase relationship between hippocampal place units and the EEG theta rhythm. Hippocampus. 1993;3:317–330. - PubMed
    1. Skaggs WE, McNaughton BL, Wilson MA, Barnes CA. Theta phase precession in hippocampal neuronal populations and the compression of temporal sequences. Hippocampus. 1996;6:149–172. - PubMed

Publication types