. 2009 Oct 15;4(10):e7441.
doi: 10.1371/journal.pone.0007441.

Stability of metabolic correlations under changing environmental conditions in Escherichia coli--a systems approach

Affiliations

Stability of metabolic correlations under changing environmental conditions in Escherichia coli--a systems approach

Jedrzej Szymanski et al. PLoS One. .

Abstract

Background: Biological systems adapt to changing environments by reorganizing their cellular and physiological program with metabolites representing one important response level. Different stresses lead to both conserved and specific responses on the metabolite level which should be reflected in the underlying metabolic network.

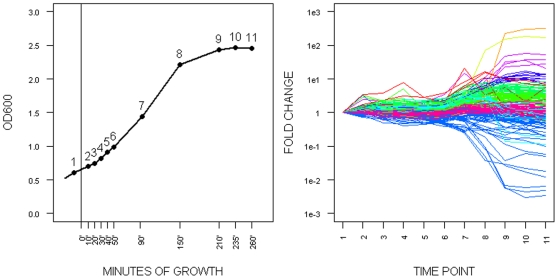
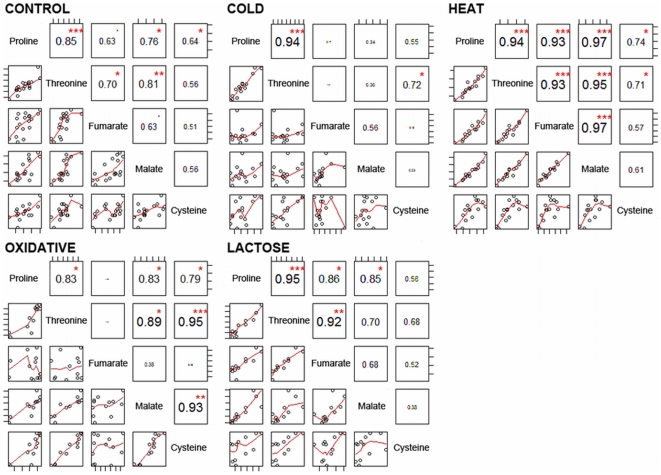
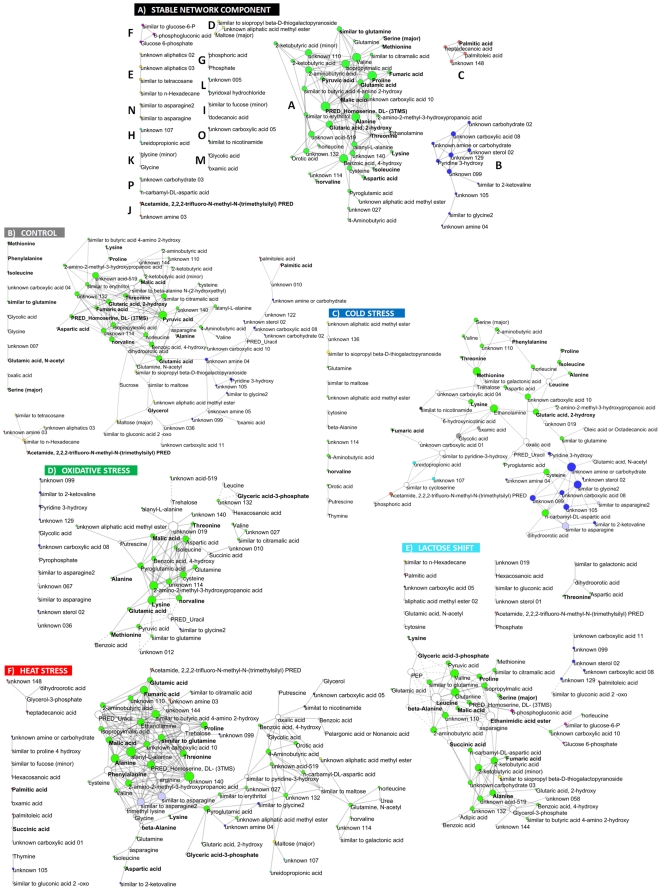
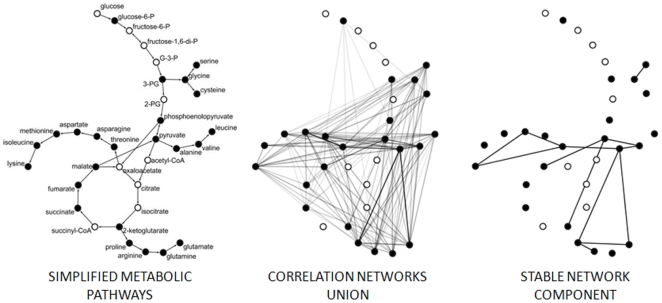
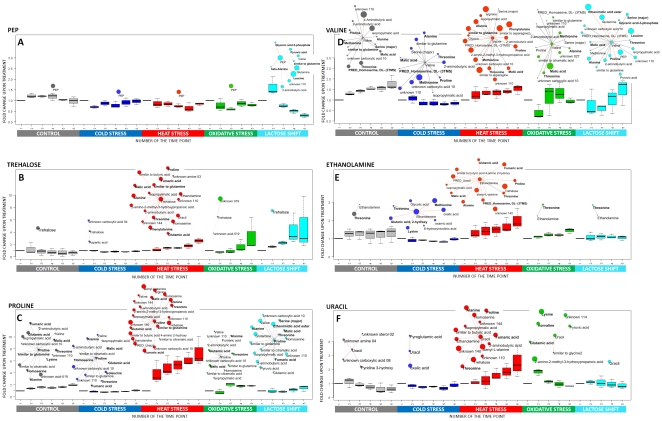
Methodology/principal findings: Starting from experimental data obtained by a GC-MS based high-throughput metabolic profiling technology we here develop an approach that: (1) extracts network representations from metabolic condition-dependent data by using pairwise correlations, (2) determines the sets of stable and condition-dependent correlations based on a combination of statistical significance and homogeneity tests, and (3) can identify metabolites related to the stress response, which goes beyond simple observations about the changes of metabolic concentrations. The approach was tested with Escherichia coli as a model organism observed under four different environmental stress conditions (cold stress, heat stress, oxidative stress, lactose diauxie) and control unperturbed conditions. By constructing the stable network component, which displays a scale free topology and small-world characteristics, we demonstrated that: (1) metabolite hubs in this reconstructed correlation networks are significantly enriched for those contained in biochemical networks such as EcoCyc, (2) particular components of the stable network are enriched for functionally related biochemical pathways, and (3) independently of the response scale, based on their importance in the reorganization of the correlation network a set of metabolites can be identified which represent hypothetical candidates for adjusting to a stress-specific response.

Conclusions/significance: Network-based tools allowed the identification of stress-dependent and general metabolic correlation networks. This correlation-network-based approach does not rely on major changes in concentration to identify metabolites important for stress adaptation, but rather on the changes in network properties with respect to metabolites. This should represent a useful complementary technique in addition to more classical approaches.


Conflict of interest statement

Competing Interests: The authors have declared that no competing interests exist.

Figures

Figure 1
Figure 1. Metabolic changes during E. coli culture growth.
(A) Growth curve (optical density) of unperturbed E. coli culture. Numbers of respective sampling time points are marked in the curve. Time point 0 minutes marks the application of the respective stress condition. (B) Relative changes of metabolites pools normalized to culture OD and time point 1. Fold change is presented on log10 scale. To reveal main trends of metabolic changes 10 K means clusters are color coded.
Figure 2
Figure 2. Example subset of metabolites showing different patterns of correlations across the treatments.
Significant correlations are marked by red stars pinpointing values significant with p-value respectively: *** <10−5, ** <10−4, ** <10−3, ‘<10−2.
Figure 3
Figure 3. Metabolic correlation networks inferred in the analysis.
(A) Structure of the stable network component composed of all metabolites exhibiting at least one stable correlation and correlations selected as stable using criteria described in text. Each component of the stable network is marked by different color. Size of the node is proportional to its degree. Metabolites exhibiting significant change in concentration in at least one of the applied conditions are marked with bold font face. All components and metabolites with known or approximate chemical structure are listed in table 3. (B–F) Stress specific networks composed of all connected metabolites and correlations specific only for particular condition. Positive correlations are represented by solid edges; negative correlations are represented by dashed edges. Components of the stable network are mapped by node colors. Size of the node is proportional to its stress specific degree. Metabolites exhibiting significant change in concentration in particular condition are marked with bold font face.
Figure 4
Figure 4. Overlap between correlation networks and metabolic pathways.
(A) A selected subset of metabolic pathways network, including TCA cycle, glycolysis and synthesis of several amino acids. Metabolites measured in our experiments are marked black. (B) Union of correlation networks obtained in 5 investigated conditions. Edges are shaded according to the number of treatments in which they were found significant. (C) Stable network component identified by testing homogeneity of the correlations obtained in different conditions.
Figure 5
Figure 5. Relative changes of metabolites concentrations and changes in their network connectivity.
Pattern of concentration changes for six selected metabolites (A: PEP (phosphoenolpyruvate); B: trehalose; C: proline; D: valine; E: ethanolamine; F: uracil) as a function of time during different stress and control conditions ( the time points relate to the time points as indicated in figure 1a) and part of the respective metabolite-metabolite correlation network observed in response to applied treatments showing the neighbours of these six metabolites ( if any). Boxplots are generated using fold change values of individual biological replicates in relation to the average value in time point 1 – before the treatment. Significantly correlating metabolites are displayed as nodes connected to the metabolite of interest with an edge. Correlation analysis confers only time points 2,3,4,5 as described in the main text. Red edge - treatment specific correlation; gray edge - correlations common for all treatments; solid edge – positive correlation; dashed edge – negative correlation. The size of the node is proportional to the number of stress specific correlations exhibited by this metabolite. Metabolites exhibiting significant changes in absolute concentrations are marked with a bold font face.

References

    1. Bijlsma R, Loeschcke V. Environmental Stress, Adaptation, and Evolution: Birkhäuser. 1997. - PubMed
    1. Hirt H, Shinozaki K. Plant Responses to Abiotic Stress: Springer. 2004.
    1. Storz G, Hengge-Aronis R. Bacterial Stress Responses: ASM Press. 2000.
    1. Stefan H, Willem HM. Yeast Stress Responses: Springer. 2003.
    1. Pomposiello PJ, Bennik MHJ, Demple B. Genome-Wide Transcriptional Profiling of the Escherichia coli Responses to Superoxide Stress and Sodium Salicylate. Journal of Bacteriology. 2001;183:3890–3902. - PMC - PubMed

Publication types