. 2009 Oct 15;4(10):e7445.
doi: 10.1371/journal.pone.0007445.

Tumor suppressor function of Syk in human MCF10A in vitro and normal mouse mammary epithelium in vivo

Affiliations

Tumor suppressor function of Syk in human MCF10A in vitro and normal mouse mammary epithelium in vivo

You Me Sung et al. PLoS One. .

Abstract

The normal function of Syk in epithelium of the developing or adult breast is not known, however, Syk suppresses tumor growth, invasion, and metastasis in breast cancer cells. Here, we demonstrate that in the mouse mammary gland, loss of one Syk allele profoundly increases proliferation and ductal branching and invasion of epithelial cells through the mammary fat pad during puberty. Mammary carcinomas develop by one year. Syk also suppresses proliferation and invasion in vitro. siRNA or shRNA knockdown of Syk in MCF10A breast epithelial cells dramatically increased proliferation, anchorage independent growth, cellular motility, and invasion, with formation of functional, extracellular matrix-degrading invadopodia. Morphological and gene microarray analysis following Syk knockdown revealed a loss of luminal and differentiated epithelial features with epithelial to mesenchymal transition and a gain in invadopodial cell surface markers CD44, CD49F, and MMP14. These results support the role of Syk in limiting proliferation and invasion of epithelial cells during normal morphogenesis, and emphasize the critical role of Syk as a tumor suppressor for breast cancer. The question of breast cancer risk following systemic anti-Syk therapy is raised since only partial loss of Syk was sufficient to induce mammary carcinomas.


Conflict of interest statement

Competing Interests: The authors have declared that no competing interests exist.

Figures

Figure 1
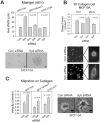
Figure 1. Cell proliferation and migration of MCF10A, MCF10AneoT, and DCIS.com human mammary epithelial cells.
(A) Decreases in Syk protein levels are shown for control versus Syk siRNA transfection of normal MCF10A cells and tumorigenic MCF10AneoT and DCIS.com cells. Increased cell proliferation (B) and cell growth (C) was observed following Syk knockdown. (D) Increased velocity of MCF10A, MCF10AneoT, and DCIS.com cell migration was observed in Syk knockdown cells using a scratch/wound assay. (B–D) Data is represented as means +/− SEM. P values are significant by the student's t-test for all cell lines, average of 3 independent experiments.
Figure 2
Figure 2. siRNA knockdown of Syk increases motility and invasive cell morphology in three dimensional cultures.
(A) Cells were transfected with control or Syk siRNA and cultured in Matrigel for 48 hours. MCF10A colony size was the most dramatically influenced by Syk knockdown. Scale bars correspond to 200 µm. (B) Cells were seeded at sub-confluent densities on top of bovine collagen I gels (3.0 mg/ml), cultured 5 or 20 hours, fixed and stained with AlexaFluor488-phalloidin. Images of cells cultured for 20 h are shown. Scale bars are 50 µm (at left) and 5 µm in the higher magnification views at right. The invasive phenotype was quantified by measuring shape factor. A shape factor of 1 is equivalent to a circle. (C) In a separate experiment, the velocity of cell migration on collagen I was determined. Scale bars are 10 µm. (A–C) P values are significant by the student's t-test for all three cell lines. Data are represented as mean +/− SEM.
Figure 3
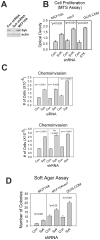
Figure 3. siRNA and shRNA knockdown of Syk enhances chemoinvasion and anchorage independent proliferation.
(A) MCF10A, MCF10AneoT, and DCIS.com cells were transduced with Syk or control shRNA in a lentiviral vector. Western blot analysis of puromycin-selected cell populations is shown. (B) The MTS proliferation assay revealed that shRNA cell lines behave similarly to the siRNA transiently transfected cells with respect to Syk knockdown; cell proliferation was enhanced. (C) Chemoinvasion assays were performed in parallel using cells transiently transfected with control or Syk siRNA or stably transduced with lentiviral control or Syk shRNA. Loss of Syk increases chemoinvasion in every case. (D). In soft agar assays, each of the Syk shRNA knockdown cell lines experienced increased colony formation. Representative images are shown in Figure S3. (B–D) Data are represented as means +/− SEM. P values are significant by the student's t-test for each cell line.
Figure 4
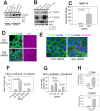
Figure 4. Syk knockdown MCF10A cells express EMT marker, invadopodia, and stem/progenitor marker proteins, and invadopodia.
(A) Cell extracts from cells cultured on plastic were blotted with anti-vimentin antibodies and then re-probed with anti-α-actin antibodies. Vimentin protein was up-regulated following Syk knockdown. (B) Cell extracts were also probed for anti-pY1045-EGFR, and then re-probed for anti-EGFR and anti-α-actin. Overall, activated EGFR was up-regulated by Syk knockdown in MCF10 and DCIS.com, but not markedly in MCF10AneoT. The top most blot is a shorter exposure than the one below it. Results for shRNA are shown in Figure S5A. (C) Flow cytometry was used to measure cell surface MMP14 staining of control versus Syk siRNA knockdown in MCF10A. Three experiments were averaged. BT549 breast cancer cells were used as positive control for cell surface MT1-MMP (mean 420.8). (D) Images from the gelatin-degradation assay for invadopodia from MCF10A cells from three color confocal imaging (phalloidin, green; cortactin, blue; gelatin, magenta). Holes are formed in the gelatin matrix (gel) following Syk siRNA knockdown. Scale bars  = 20 µm. A higher magnification view of the area within the red boxes is shown in Figure S5B. (E) Three color confocal images were taken of cells cultured on crosslinked gelatin showing the distribution of DAPI (nuclei, blue), phalloidin (F-act, green), and vimentin (magenta) in control versus Syk siRNA transfected MCF10A cells. Scale bars  = 20 µm. (F) Invadopodia activity was upregulated in Syk siRNA transfected MCF10A. (G) Number of vimentin positive cells was increased in Syk siRNA transfected MCF10A cells in non-confluent and confluent cultures. (H) Results for two color flow cytometry from three experiments each for cell surface CD44/CD24 and CD49f/CD24 demonstrate significant elevation in CD44 and CD49f at the cell surface following Syk knockdown by siRNA in MCF10A cells.
Figure 5
Figure 5. Enhanced branching morphogenesis in mammary glands of Syk +/− mice.
(A) Syk protein is decreased in mammary gland extracts (minus the mammary gland lymph node) and spleen from 12-week virgin Syk +/− heterozygous compared with Syk +/+ wild type females. Spleen extracts were used as positive control. (B) The average number of buds were counted in mammary glands from Syk +/+ wild type (black bars) and Syk +/− heterozygous mice (gray bars) from 3-, 6-, 8-, 10-, 12-week virgin and early and late pregnancy females (EP and LP, respectively). P value was significant by the student's t-test for 6-, 8-, 10-, 12-week virgin females and early- and late-pregnancy females (n = 3 animals per time point). In a separate experiment, mammary glands from 10 additional wild type and 10 heterozygous knockout Syk mice were examined at 8 weeks confirming the increase in bud formation after partial Syk loss (B, inset). Data are represented as means from three mice +/− SEM except for B, inset, where n = 10 mice. (C) Representative images of mammary glands from Syk +/+ wild type and Syk +/− heterozygote knockout mice. Scale bars correspond to 150 µm in all panels. (D) The mean distance was determined from lymph node to the distal end of ducts in mammary glands from Syk +/+ wild type (black bars) and Syk +/− heterozygous mice (gray bars) at 10-day and 3-,6-,8-,10, 12-week virgin and early and late pregnancy females (n = 3 animals per time point). P value is significant by the student's t-test for 3-, 6-, 8-week virgin females and late-pregnancy females. Data are represented as means +/− SEM for three glands each.
Figure 6
Figure 6. Heterozygous Syk knockout accelerates cell proliferation and invasiveness of mouse mammary epithelial cells.
(A) Representative images illustrate sections triple stained with anti-Ki67 (red), anti-keratin14 (CK14m green), and DAPI (blue) from mammary glands of Syk +/+ wild type and Syk +/− heterozygous mice from 12-week virgin females. Scale bars correspond to 30 µm. (B) Increased mammary epithelial cell proliferation was quantified from images illustrated in (A) in three animals for each point. (C) Primary cell cultures also exhibit increased cell proliferation. Total % of cells in S-phase was quantified in primary cells from Syk +/+ wild type and Syk +/− heterozygous mice from 12-week virgin females. (D) Freshly isolated primary mammary epithelial cells were embedded Matrigel. Organoids were imaged at 24 hrs and show greatly enhanced size in Syk heterozygous knockdown compared with wild type glands. A typical invasive leading edge is indicated (arrow). Scale bars correspond to 50 µm. Increased cellular area (E) and fiber length (F) of organoids was assessed using Metamorph Image software. In all cases (B–F), data is represented by means +/− SEM. P values are significant by the student's t-test.
Figure 7
Figure 7. Heterozygous Syk +/− mice develop mammary gland hyperplasia and ductal carcinoma.
(A) At one year in virgin females, 4th inguinal mammary glands reveal a denser epithelial network in heterozygote compared to wild type glands. Insets at right are higher magnification views of the distal ductal tree. An area of hyperplasia in the heterozygote gland (Syk +/−) indicated by a red box is enlarged. Scale bars correspond to 5 mm and 250 µm insets at right and 1 mm inset below. (B) Multiphoton imaging of carmine red autofluorescence in whole mounts of the Syk +/− gland revealed that the branching epithelium is over developed but lumens are visible (X-Y, inset at left). The hyperplastic portion contains no lumens (X-Y, inset at right). Scale bars correspond to 50 µm. (C) Hemotoxylin/eosin stained paraffin section from an invasive ductal carcinoma taken from a one year, virgin female Syk +/−. Scale bar is 50 µm.

References

    1. Coopman PJ, Mueller SC. The Syk tyrosine kinase: a new negative regulator in tumor growth and progression. Cancer Letters. 2006;241:159–173. - PubMed
    1. Muthusamy V, Duraisamy S, Bradbury CM, Hobbs C, Curley DP, et al. Epigenetic silencing of novel tumor suppressors in malignant melanoma. Cancer Res. 2006;66:11187–11193. - PubMed
    1. Liu S, Ren S, Howell P, Fodstad O, Riker AI. Identification of novel epigenetically modified genes in human melanoma via promoter methylation gene profiling. Pigment Cell Melanoma Res. 2008 - PubMed
    1. Moroni M, Soldatenkov V, Zhang L, Zhang Y, Stoica G, et al. Progressive loss of Syk and abnormal proliferation in breast cancer cells. Cancer Res. 2004;64:7346–7354. - PubMed
    1. Zhang X, Shrikhande U, Alicie BM, Zhou Q, Geahlen RL. Role of the protein tyrosine kinase Syk in regulating cell-cell adhesion and motility in breast cancer cells. Mol Cancer Res. 2009;7:634–644. - PMC - PubMed

Publication types