. 2009 May 1;3(2):91-107.
doi: 10.2174/157340507780619179.

Dynamic Contrast Enhanced Magnetic Resonance Imaging in Oncology: Theory, Data Acquisition, Analysis, and Examples

Affiliations

Dynamic Contrast Enhanced Magnetic Resonance Imaging in Oncology: Theory, Data Acquisition, Analysis, and Examples

Thomas E Yankeelov et al. Curr Med Imaging Rev. .

Abstract

Dynamic contrast enhanced MRI (DCE-MRI) enables the quantitative assessment of tumor status and has found application in both pre-clinical tumor models as well as clinical oncology. DCE-MRI requires the serial acquisition of images before and after the injection of a paramagnetic contrast agent so that the variation of MR signal intensity with time can be recorded for each image voxel. As the agent enters into a tissue, it changes the MR signal intensity from the tissue to a degree that depends on the local concentration. After the agent is transported out of the tissue, the MR signal intensity returns to its' baseline value. By analyzing the associated signal intensity time course using an appropriate mathematical model, physiological parameters related to blood flow, vessel permeability, and tissue volume fractions can be extracted for each voxel or region of interest.In this review we first discuss the basic physics of this methodology, and then present technical aspects of how DCE-MRI data are acquired and analyzed. We also discuss appropriate models of contrast agent kinetics and how these can be used to elucidate tissue characteristics of importance in cancer biology. We conclude by briefly summarizing some future goals and demands of DCE-MRI.


Figures

Fig. 1
Fig. 1
A patient diagnosed with an invasive ductal carcinoma. Panel a is the pre-contrast injection T1-weighted sagittal image and panel b is the T1 map; the lesion is easily delineated from the surrounding healthy-appearing tissue. Panel c depicts typical enhancement curves from two ROIs labeled on panel b. The leftmost white circle in panel b corresponds to the filled circles in panel c, while the rightmost white circle corresponds to the open circles in panel b. The fits of the data are depicted as the solid lines in panel c and the arterial input function (i.e., the time course of CA in the blood) used to perform those fits is shown in the inset. ROI 2 has a more rapid enhancement: Ktrans = 0.063 min−1 for ROI 1 and Ktrans = 0.12 min−1 for ROI 2. It is the ability to probe this intra-tumoral heterogeneity non-invasively and longitudinally that make these techniques potentially so powerful. Performing this type of analysis for every voxel allows the construction of the pharmacokinetic parameter maps of Fig. 6.
Fig. 2
Fig. 2
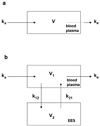
The simplest pharmacokinetic model is depicted in panel a. A drug enters the compartment, V, with a specific rate constant ka, and is eliminated with a rate constant ke. A more realistic approach is described by the two-compartment model depicted in panel b which considers the extracellular intravascular space (blood plasma) to be the central compartment (V1), and the extravascular-extracellular space (EES) to be the peripheral compartment (V2). In this model, the CA is introduced into the vasculature and transported into the EES in a reversible process characterized by a distribution rate constant (k12) and a redistribution rate constant (k21).
Fig. 3
Fig. 3
The results of fitting two arbitrary nine voxel TOI curves (solid circles) with both the Eq. (22) (solid curve) model. The different curve shapes yield different Ktrans and ve values as discussed in the text.
Fig. 4
Fig. 4
The results of applying a DCE-MRI protocol to the entire tumor region as a function of time. Each row corresponds to an imaging day and presents the results of the parametric ve (a, e, i) and Ktrans (b, f, j) tumor mappings of a central slice as well as the corresponding 3-D volume representations (ve: c, g, k; Ktrans: d, h, l). Note the color scale on the far right and the distance scale in the lower right hand corner of each Ktrans volume rendering. See text for discussion of parameter changes as a function of time
Fig. 5
Fig. 5
The ability to measure pharmacokinetic parameters as a function of time allows for the potential of characterizing response to treatment. Here 4T1 mammary carcinomas (control and treated by an anti-angiogenic agent) are followed over 16 days by DCE-MRI Ktrans maps. By day 16 it is evident that the treated animal has significantly lower Ktrans values than the control. This approach not only allows for comparing groups, but also lets each animal serve as its own control.
Fig. 6
Fig. 6
Pre (top row) and post-treatment (bottom row) each parameter’s assessment of tumor extent of a representative patient (different from that displayed in figure 2) are presented. (Treatment included four cycles of Taxotere.) The volume on the far left is that obtained from the Ktrans parameter and is rendered at 50% of the maximum value obtained from the pre-treatment study. Comparing the top row to the bottom row, the T1, Ktrans, and ve maps all have a significant drop in parameter values and indicate a tremendous drop in extent of disease.

References

    1. Ribatti D, Vacca A, Presta M. The discovery of angiogenic factors: a historical review. Gen Pharmacol. 2000;35:227–231. - PubMed
    1. Folkman J. Role of angiogenesis in tumor growth and metastasis. Semin Oncol. 2002;29 6 Suppl 16:15–18. - PubMed
    1. Folkman J. Angiogenesis in cancer, vascular, rheumatoid and other disease. Nat Med. 1995;1:27–31. - PubMed
    1. Atri M. New Technologies and Directed Agents for Applications of Cancer Imaging. J Clin Onc. 2006;24:3299–3308. - PubMed
    1. Carmellet P, Jain RK. Angiogenesis in cancer and other diseases. Nature. 2000;407:249–257. - PubMed