Comparative Study
. 2009;10(10):R114.
doi: 10.1186/gb-2009-10-10-r114. Epub 2009 Oct 15.

Transcriptome analysis of functional differentiation between haploid and diploid cells of Emiliania huxleyi, a globally significant photosynthetic calcifying cell

Affiliations
Comparative Study

Transcriptome analysis of functional differentiation between haploid and diploid cells of Emiliania huxleyi, a globally significant photosynthetic calcifying cell

Peter von Dassow et al. Genome Biol. 2009.

Abstract

Background: Eukaryotes are classified as either haplontic, diplontic, or haplo-diplontic, depending on which ploidy levels undergo mitotic cell division in the life cycle. Emiliania huxleyi is one of the most abundant phytoplankton species in the ocean, playing an important role in global carbon fluxes, and represents haptophytes, an enigmatic group of unicellular organisms that diverged early in eukaryotic evolution. This species is haplo-diplontic. Little is known about the haploid cells, but they have been hypothesized to allow persistence of the species between the yearly blooms of diploid cells. We sequenced over 38,000 expressed sequence tags from haploid and diploid E. huxleyi normalized cDNA libraries to identify genes involved in important processes specific to each life phase (2N calcification or 1N motility), and to better understand the haploid phase of this prominent haplo-diplontic organism.

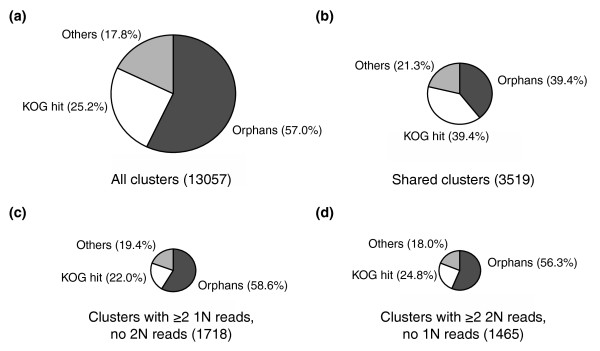
Results: The haploid and diploid transcriptomes showed a dramatic differentiation, with approximately 20% greater transcriptome richness in diploid cells than in haploid cells and only <or= 50% of transcripts estimated to be common between the two phases. The major functional category of transcripts differentiating haploids included signal transduction and motility genes. Diploid-specific transcripts included Ca2+, H+, and HCO3- pumps. Potential factors differentiating the transcriptomes included haploid-specific Myb transcription factor homologs and an unusual diploid-specific histone H4 homolog.

Conclusions: This study permitted the identification of genes likely involved in diploid-specific biomineralization, haploid-specific motility, and transcriptional control. Greater transcriptome richness in diploid cells suggests they may be more versatile for exploiting a diversity of rich environments whereas haploid cells are intrinsically more streamlined.


Figures

Figure 1
Figure 1
Flow cytometry plot showing conditions of cells in cultures on day of harvesting. (a) 1N and, (b) 2N cells (red) were identified by chlorophyll autofluorescence and their forward scatter (FSC) and side scatter (SSC) were compared to 1 μm bead standards (green).
Figure 2
Figure 2
Cell cycle changes during the day-night cycle of harvesting. Example DNA content histograms of nuclear extracts taken from 1N cultures at different times are shown. The time point at 15 h on day 1 is not shown but had a similar distribution to that at 19 h on day 1 and 15 h30 on day 2. RNA was not collected at 15 h30 on day 2, but nuclear extracts (shown here), flow cytometric profiles, and Fv/Fm confirmed cells had returned to the same state after a complete diel cycle. Extracted nuclei were stained with Sybr Green I and analyzed by flow cytometry.
Figure 3
Figure 3
Venn diagram showing the degree of overlap existing E. huxleyi EST libraries. Included are the libraries analyzed in this study (1N RCC1217 and 2N RCC1216, combined) and the two other publicly available EST libraries (CCMP 1516 and CCMP371). ESTs were considered matching based on BLAT criteria of an alignment length of ≥ 100 nucleotides and ≥ 95% identity. The degrees of overlap increased only very modestly when the BLAT criteria were relaxed to an alignment length of ≥ 50 nucleotides.
Figure 4
Figure 4
Distribution of clusters and reads by KOG functional class and library. Distributions of clusters over KOG class for clusters shared between the 1N and 2N libraries and clusters unique to each library. Fisher's exact test was used to determine significant differences in the distribution of clusters by KOG class between the 1N-unique and 2N-unique sets (asterisks indicate the KOG classes exhibiting significant differences between the 1N-unique and 2N-unique sets); P < 0.002 without correction for multiple tests). The same test was applied to determine differences in the distribution of clusters by KOG class between the set of shared clusters and both 1N-unique and 2N-unique clusters (the at symbol (@) indicates KOG classes exhibiting significant differences between the 1N-unique and shared sets; P < 0.002 without correction for multiple tests).
Figure 5
Figure 5
The taxonomic distribution of homology. Shown are the percentages of clusters with KEGG homologs that have the 'best hit' in each taxonomic group. Indicated are cases where the proportion of clusters best hitting to the taxonomic group differs between 1N-unique and 2N-unique (asterisks) or between 1N-unique and shared clusters (at symbol (@)), tested as above. The inset shows the proportion of all assigned clusters that are accounted for by best-hits to Chlamydomonas reinhardtii (a subset of those which are best-hits to Viridiplantae). The differences between 1N-unique and 2N-unique, and between 1N-unique and shared clusters were significant (P < 0.002).
Figure 6
Figure 6
The proportion of orphan clusters. Non-orphan clusters that do not have hits in the KOG database are also represented (Others). (a) All clusters. (b) Shared clusters composed of reads in both 1N and 2N libraries. (c) Potentially 1N-specific clusters composed of two or more reads in the 1N library but zero in the 2N library. (d) Potentially 2N-specific clusters composed of two or more reads in the 2N library but zero in the 1N library.
Figure 7
Figure 7
RT-PCR confirmation of expression of selected flagellar-related genes only in 1N cells. All reactions were run with the same RT+ cDNA samples. The RT-PCR shown at the top used the elongation factor 1α (GS000217) as a positive (loading) control showing successful cDNA amplification occurred in all samples. RT- control reactions prepared from the same RNA were run for nine of the PCRs shown here and no contaminating genomic DNA (gDNA) was ever found (see examples with RT- reactions included in Figure S6 in Additional data file 1). For clarity, RT- control reactions run simultaneously have been cut out here. Positions of molecular weight markers on each side of the gel are shown. The sample identifiers are listed for each lane at the top of the gel. 11 h, harvested at 11 h (late morning); 21 h, harvested at 21 h (early evening, time of S-phase); 02 h, harvested at 02 h (after cell division); CL, cultures (1N only) exposed to continuous light.
Figure 8
Figure 8
RT-PCR tests of expression patterns of selected genes chosen by digital subtraction. RT- control reactions prepared from the same RNA were run for six of the PCRs shown here and no contaminating genomic DNA (gDNA) was ever found. For clarity, RT- control reactions run simultaneously have been cut out here. Positions of molecular weight markers on each side of the gel are shown. The sample identifiers are listed for each lane at the top of the gel (as for Figure 7).
Figure 9
Figure 9
RT-PCR determination of expression patterns of selected genes potentially related to biomineralization. RT- control reactions prepared from the same RNA were run for all of the PCRs shown here and no contaminating genomic DNA (gDNA) was ever found. For clarity, these RT- control reactions run simultaneously have been cut out here. Positions of molecular weight markers on each side of the gel are shown. The sample identifiers are listed for each lane at the top of the gel (as for Figure 7).
Figure 10
Figure 10
RT-PCR determination of expression patterns of selected histone genes. Positions of molecular weight markers on each side of the gel are shown. The sample identifiers are listed for each lane at the top of the gel (as for Figure 7).

Similar articles

Cited by

References

    1. de Vargas C, Aubry M-P, Probert I, Young J. In: Evolution of aquatic photoautotrophs. Falkowski PG, Knoll AH, editor. New York: Academic Press; 2007. Origin and evolution of coccolithophores: From coastal hunters to oceanic farmers. pp. 251–285.
    1. Andersen RA. Biology and systematics of heterokont and haptophyte algae. Am J Bot. 2004;91:1508–1522. - PubMed
    1. Young JR, Geisen M, Probert I. A review of selected aspects of coccolithophore biology with implications for paleodiversity estimation. Micropaleontology. 2005;51:1–22.
    1. Burki F, Shalchian-Tabrizi K, Pawlowski J. Phylogenomics reveals a new 'megagroup' including most photosynthetic eukaryotes. Biol Lett. 2008;4:366–369. - PMC - PubMed
    1. Sanchez-Puerta MV, Delwiche CF. A hypothesis for plastid evolution in chromalveolates. J Phycol. 2008;44:1097–1107. - PubMed

Publication types

MeSH terms

LinkOut - more resources