. 2009 Oct 16;31(4):621-31.
doi: 10.1016/j.immuni.2009.08.024.

The strength of T cell receptor signal controls the polarization of cytotoxic machinery to the immunological synapse

Affiliations

The strength of T cell receptor signal controls the polarization of cytotoxic machinery to the immunological synapse

Misty R Jenkins et al. Immunity. .

Abstract

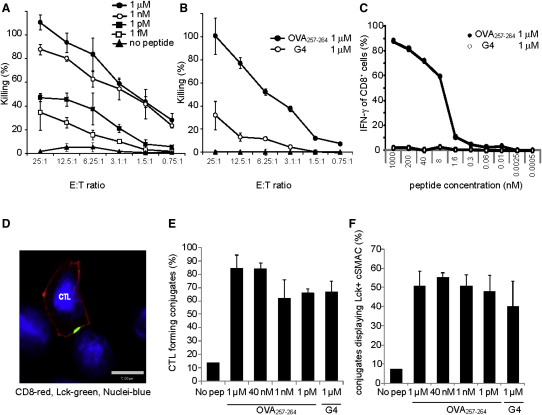
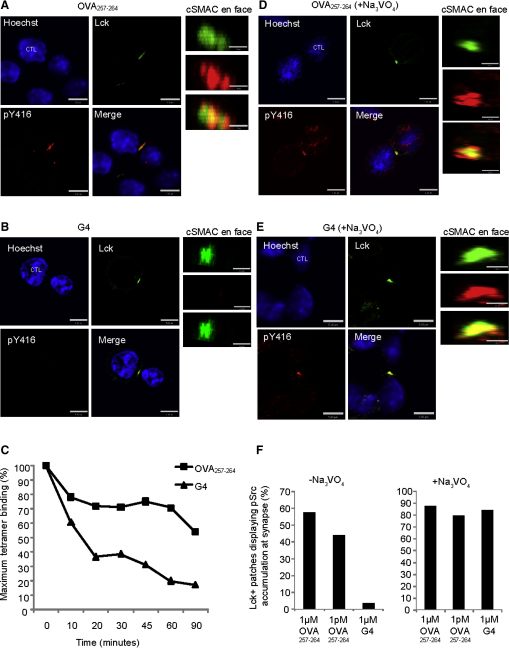
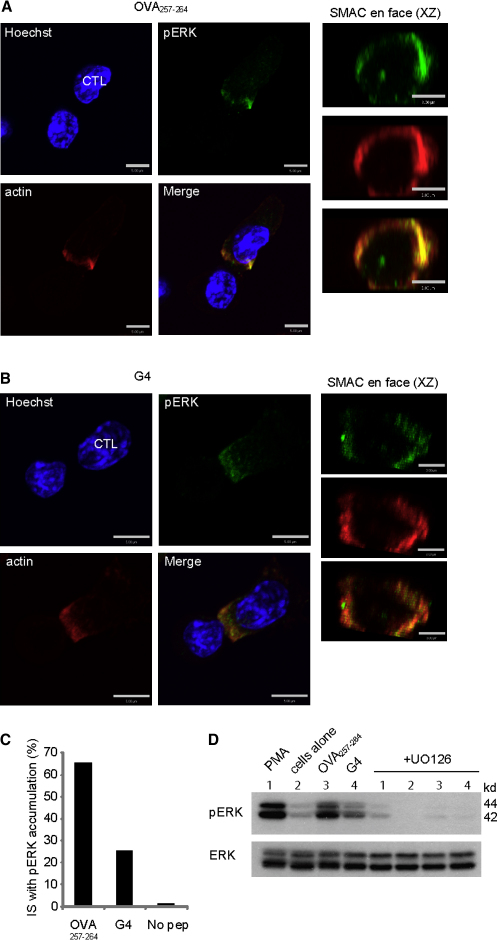
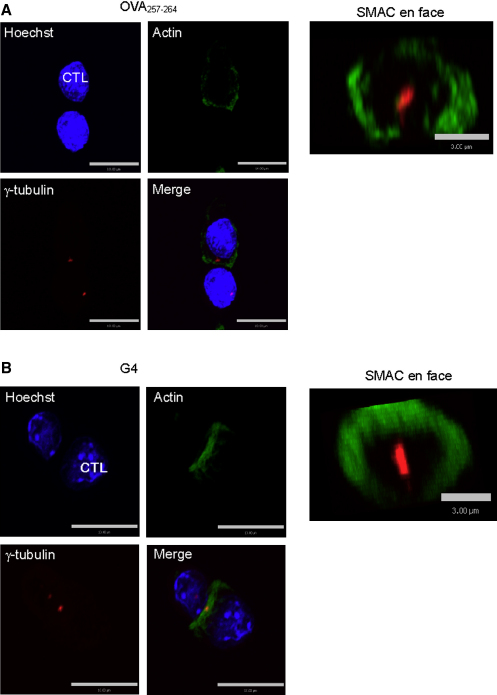
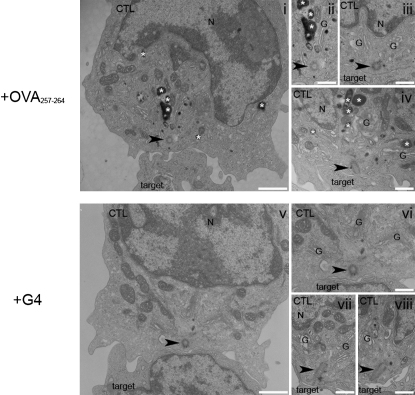
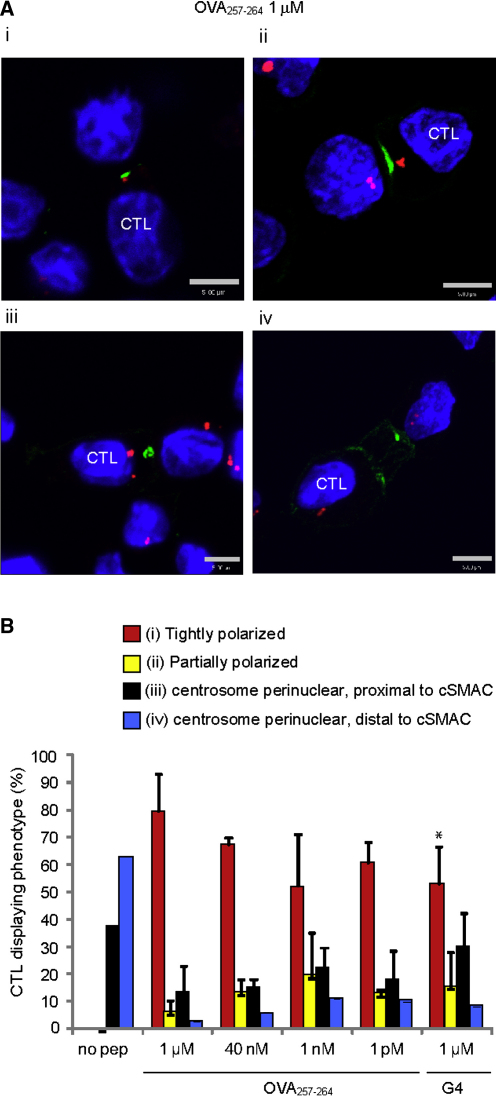
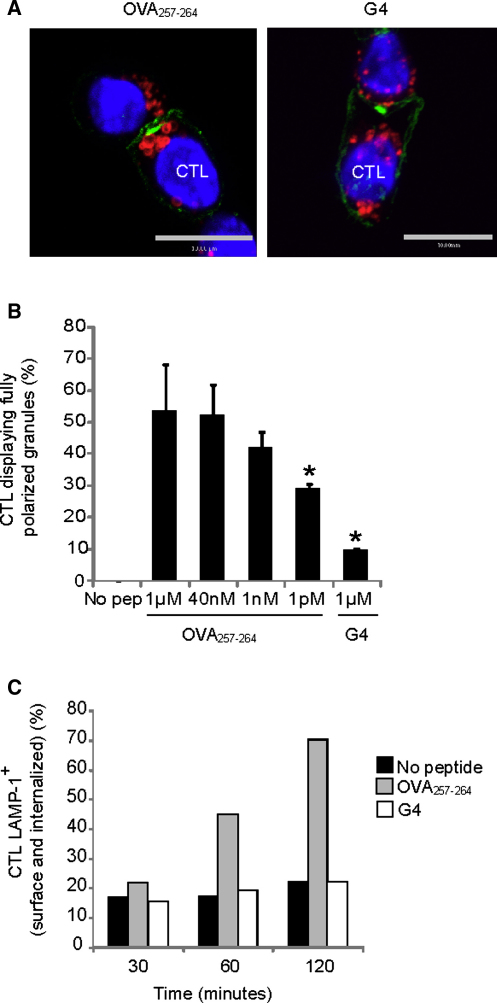
Killing by cytotoxic T lymphocytes (CTLs) is mediated by the secretion of lytic granules. The centrosome plays a key role in granule delivery, polarizing to the central supramolecular activation complex (cSMAC) within the immunological synapse upon T cell receptor (TCR) activation. Although stronger TCR signals lead to increased target cell death than do weaker signals, it is not known how the strength of TCR signal controls polarization of the centrosome and lytic granules. By using TCR transgenic OT-I CTLs, we showed that both high- and low-avidity interactions led to centrosome polarization to the cSMAC. However, only high-avidity interactions, which induced a higher threshold of intracellular signaling, gave rise to granule recruitment to the polarized centrosome at the synapse. By controlling centrosome and granule polarization independently, the centrosome is able to respond rapidly to weak signals so that CTLs are poised and ready for the trigger for granule delivery.


Figures

Figure 1
Figure 1
OT-I Conjugate Formation and Effector Responses to OVA257-264 and G4 (A and B) OT-I CTL incubated with EL4 targets, peptide pulsed with (A) differing concentrations of OVA257-264 peptide or with (B) 1 μM OVA257-264 or G4. Graphs show the mean percent cytotoxicity of triplicates ± SD for varying effector to target (E:T) ratios and are representative of four independent experiments. (C) Graph of the mean percent CTLs stained intracellularly for IFN-γ and analyzed by flow cytometry at peptide concentrations shown for G4 (open circles) and OVA257-264 (closed circles). (D–F) OT-I conjugated to OVA257-264 and G4 peptide-pulsed EL4 target cells at 37°C for 20 min, stained with anti-Lck (AlexaFluor 488; green) and anti-CD8 (AlexaFluor 546; red). An example of Lck clustering at the cSMAC (single-plane confocal image) (D); the mean percent of CTLs in conjugates (E); and the mean percent of conjugates with Lck accumulation at the immunological synapse (F) is shown (±SD, average of four experiments). Four separate experiments were carried out for each set of conditions. At least 300 conjugates were counted for each experiment, and graphs show the mean of four independent experiments. Differences were not statistically significant according to a Student's t test (p > 0.06). Scale bar represents 5 μM.
Figure 2
Figure 2
cSMAC Activation Correlates with Avidity (A and B) Target EL4 cells pulsed with (A) 1 μM OVA257-264 or (B) G4 peptides, conjugated to in vitro activated OT-I CTLs, stained with anti-Lck (488, green) and pY416 (546, red). Images are shown as projections through the xy plane, or xz plane reconstructed from a 1 μM section across the synapse (en face). Scale bars represent 1.5 μM. (C) Graph showing the percent maximum tetramer stained OT-I relative to time zero for OVA257-264-Kb-PE, and G4-Kb-PE tetramers over 1 hr at 37°C, detected by flow cytometry. (D and E) Conjugates prepared as in (A) and (B), but preincubated with orthovanadate. (F) The mean percent (from two experiments) of Lck+ staining synapses with distinct pY416 accumulation in the presence or absence of sodium orthovanadate.
Figure 3
Figure 3
Phospho-ERK Accumulates in the dSMAC, with Actin (A and B) Immunofluorescent images of in vitro activated OT-I cells conjugated to target EL4 cells, prepulsed with either (A) 1 μM OVA257-264 or (B) 1 μM G4 peptides. Cells are stained with Hoechst (blue) and antibodies against pERK (AlexaFluor 488; green) and actin (AlexaFluor 546; red). Confocal projections of conjugates are shown in the xy plane (scale bars represent 5 μM) or as reconstructions across 1 μM of synapse (en face) (scale bars represent 3 μM). (C) Quantitation of percent conjugates with the centrosome polarized to the synapse, displaying pERK accumulation at the dSMAC (n = 100) from three separate experiments. (D) Immunoblot of cell lysates from OT-I CTLs stimulated with 50 nM PMA (1), untreated (2), or stimulated with 1 μM OVA257-264 (3) or G4 peptide (4), in the presence or absence of UO126 MEK inhibitor, probed with antibodies against pERK or total ERK. Molecular weights are shown. Representative of two separate experiments.
Figure 4
Figure 4
Actin Clearance and Centrosome Polarization at the Immunological Synapse of OVA257-264 and G4 Conjugates OT-I conjugates with EL4 pulsed with (A) 1 μM OVA257-264 or (B) G4. Conjugates are stained with Hoechst (blue), actin (AlexaFluor 488; green), and γ-tubulin (AlexaFluor 546; red). Images show a confocal projection through the xy axis of conjugates (scale bars represent 10 μM), and a 1 μM projection through the z axis of the SMAC (en face) (scale bars represent 3 μM).
Figure 5
Figure 5
Polarization of the Centrosome in CTL-Target Cell Conjugates Low- (i, v) and high- (ii–iv, vi–viii) power electron micrographs showing thin (50–100 nm) sections of OT-1-EL4 conjugates with 1 μM OVA257-264 (i–iv) or G4 (v–viii). OT-I (CTL), lytic granules (white asterisks), polarized centrioles (arrowheads), Golgi complex (G), nucleus (N). Scale bars represent 1 μm (i, v) or 0.5 μm (ii–iv, vi–viii).
Figure 6
Figure 6
Quantitation of Centrosome Polarization (A) OT-I CTLs conjugated to target EL4 cells, pulsed with 1 μM OVA257-264 peptide, stained with Hoechst (blue), and labeled with antibodies against Lck (Alexa Fluor 488; green) and γ-tubulin (Alexa Fluor 546; red). Examples of centrosome localization illustrating different phenotypes are shown: (i) centrosome tightly polarized to the cSMAC, (ii) centrosome partially polarized to the cSMAC, (iii) centrosome perinuclear, proximal to the cSMAC, or (iv) centrosome perinuclear, distal from the immunological synapse (scale bars represent 5 μM). (B) Percentages of conjugates displaying each phenotype shown in (A), with varying peptide concentrations. Graph displays the mean percent OT-I with each phenotype from three or more independent experiments ± SD. Statistical significance between OVA257-264 1 μM and G4 1 μM was determined by Student's t test, where p = 0.01 (asterisk). A minimum of 247 conjugates were counted for each set of conditions and the graphs show the mean scores of four independent experiments.
Figure 7
Figure 7
Granule Polarization and Release by OVA257-264 and G4 Conjugates (A and B) OT-I CTLs conjugated to target EL4 cells, pulsed with different concentrations of OVA257-264 or 1 μM G4 peptide, and labeled for confocal microscopy with Hoechst (blue, nuclei) and antibodies against LAMP-1, to identify granules (red), and Lck to label the cSMAC (green). Representative immunofluorescent projections of OVA257-264 (left) and G4 (right) conjugates are shown (A). The mean percent of Lck+ conjugates displaying fully polarized granules to the immunological synapse was quantitated (B) and displayed as the mean percent of more than three independent experiments ± SD (n > 163). Statistical significance, p ≤ 0.05 (asterisk) was determined with a Student's t test. Scale bars represent 10 μM. (C) LAMP-1 degranulation assay showing percent LAMP-1+ OT-I, after incubation with EL4 cells pulsed with no peptide (black bars), 1 μM OVA257-264 (gray bars), 1 μM G4 (white bars) for 30, 60, or 120 min, in the presence of LAMP-1-PE. Representative of three separate experiments.

Comment in

References

    1. al-Ramadi B.K., Jelonek M.T., Boyd L.F., Margulies D.H., Bothwell A.L. Lack of strict correlation of functional sensitization with the apparent affinity of MHC/peptide complexes for the TCR. J. Immunol. 1995;155:662–673. - PubMed
    1. Alam S.M., Travers P.J., Wung J.L., Nasholds W., Redpath S., Jameson S.C., Gascoigne N.R. T-cell-receptor affinity and thymocyte positive selection. Nature. 1996;381:616–620. - PubMed
    1. Alam S.M., Davies G.M., Lin C.M., Zal T., Nasholds W., Jameson S.C., Hogquist K.A., Gascoigne N.R., Travers P.J. Qualitative and quantitative differences in T cell receptor binding of agonist and antagonist ligands. Immunity. 1999;10:227–237. - PubMed
    1. Alcover A., Alarcon B. Internalization and intracellular fate of TCR-CD3 complexes. Crit. Rev. Immunol. 2000;20:325–346. - PubMed
    1. Boerth N.J., Judd B.A., Koretzky G.A. Functional association between SLAP-130 and SLP-76 in Jurkat T cells. J. Biol. Chem. 2000;275:5143–5152. - PubMed

Publication types

MeSH terms