. 2009 Oct 16;31(4):632-42.
doi: 10.1016/j.immuni.2009.09.004.

Kinetics of early T cell receptor signaling regulate the pathway of lytic granule delivery to the secretory domain

Affiliations

Kinetics of early T cell receptor signaling regulate the pathway of lytic granule delivery to the secretory domain

Allison M Beal et al. Immunity. .

Abstract

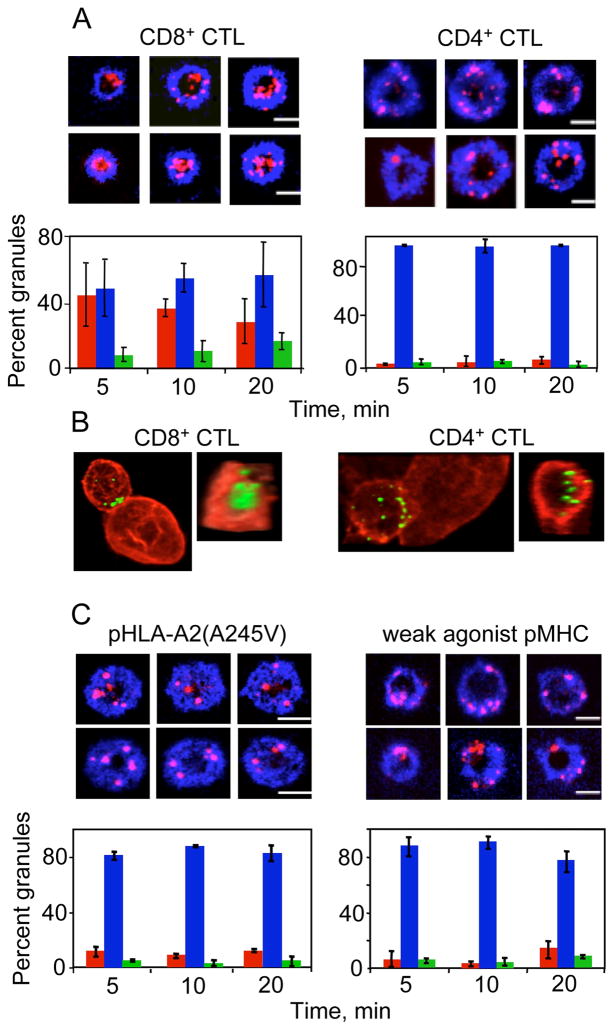
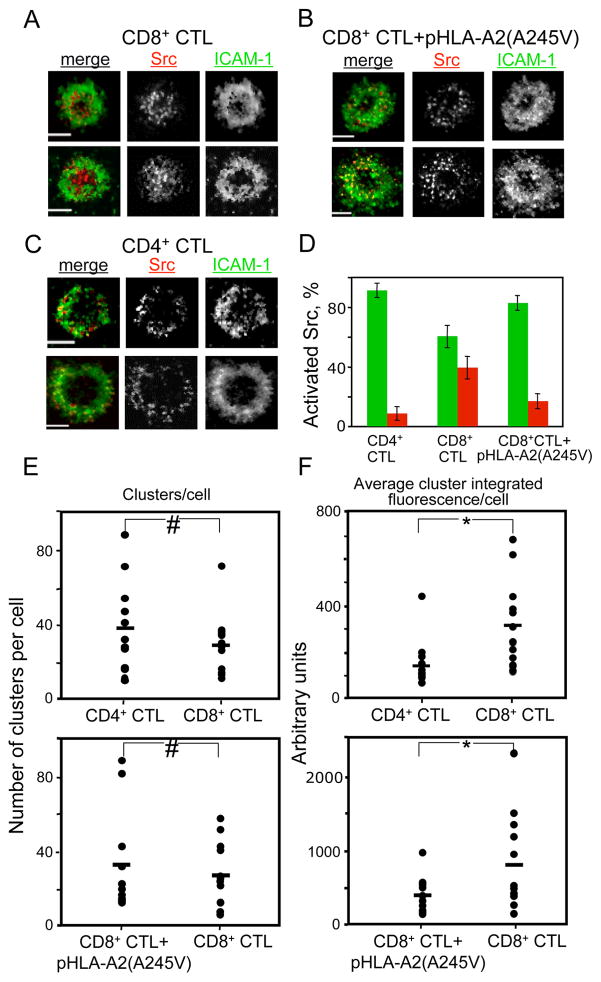
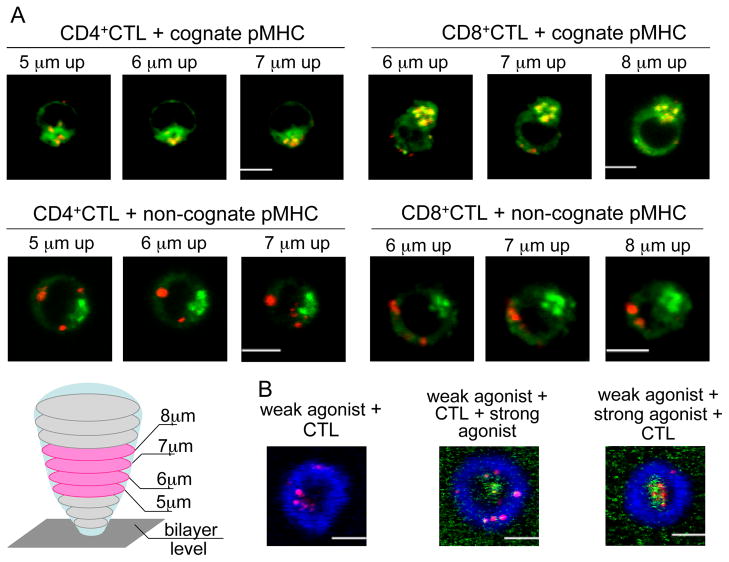
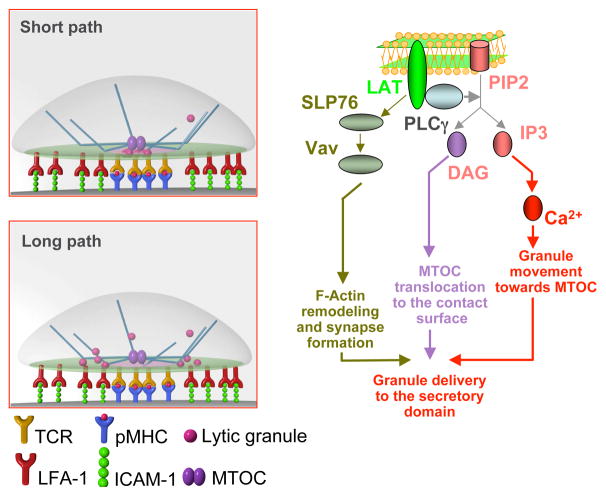
Cytolytic granules mediate killing of virus-infected cells by cytotoxic T lymphocytes. We show here that the granules can take long or short paths to the secretory domain. Both paths utilized the same intracellular molecular events, which have different spatial and temporal arrangements and are regulated by the kinetics of Ca(2+)-mediated signaling. Rapid signaling caused swift granule concentration near the microtubule-organizing center (MTOC) and subsequent delivery by the polarized MTOC directly to the secretory domain-the shortest path. Indolent signaling led to late recruitment of granules that moved along microtubules to the periphery of the synapse and then moved tangentially to fuse at the outer edge of the secretory domain-a longer path. The short pathway is associated with faster granule release and more efficient killing than the long pathway. Thus, the kinetics of early signaling regulates the quality of the T cell cytolytic response.


Figures

Figure 1
Figure 1. Integrated strength of TCR engagement influences the pattern of granule polarization within the cytolytic synapse
(A) CD8+ CTL concentrate a significant amount of polarized granules in the cSMAC, while polarized granules in CD4+ CTL are mostly observed within the pSMAC. Representative images of CD8+ CER43 CTL (top left) and CD4+ AC-25 CTL (top right) interacting with bilayers containing respective agonist pMHC ligands and ICAM-1 are shown. ICAM-1 is blue and granule staining is red. Scale bar: 5μm. The percent of granules localized in the cSMAC (red bars), pSMAC (blue bars), and cSMAC/pSMAC junction (green bars) in CD8+ CTL (bottom left) and CD4+ CTL (bottom right) at the CTL/bilayer interface is shown in the graphs. More than 43 IS forming cells were analyzed for each time point in 3 independent experiments. (B). Distribution of polarize granules in CD8+ (left) and CD4+ (right) CTL contacting live target cells bearing respective cognate pMHC proteins. One representative conjugate from two independent experiments, each from CD8+ CTL and CD4+ CTL, is shown (left panels). Corresponding en face projections of the cell-cell contact site are presented on the right panels. 82.4% (14 out of 17) of the CD8+ CTL conjugates had granules (green) within the cSMAC surrounded by a peripheral actin ring (red). The majority (82.6% or 14 out of 18) of the CD4+ CTL conjugates demonstrated scattered granules at the synapse. (C) Weakening of TCR-pMHC interactions in CD8+ CTL resulted in redistribution of polarized granules to the pSMAC. Top: Representative images of CD8+ CTL interacting with bilayers containing ICAM-1 and the indicated pMHC molecules are shown. ICAM-1 is in blue and granules are in red. Scale bar: 5μm. Bottom: The percentage of granules localized in the pSMAC, cSMAC, and pSMAC/cSMAC junction is plotted below the images as described in Figure 1A. At least 20 IS forming cells were analyzed for each time point in 2 independent experiments.
Figure 2
Figure 2. Similarities and differences in TCR-mediated signaling in CTL exercising more and less effective cytolytic responses
Representative TIRF images of CD8+ CTL interacting with ICAM-1-containing bilayers that display either intact cognate pHLA-A2 (A) or the pHLA-A2(A245V) molecules (B) or CD4+ CTL contacting the bilayers with cognate pMHC-II proteins (C) are shown. ICAM-1 is green, and activated Src kinases are red. Scale bar: 5μm. (D) The percentage of the fluorescence signal of the phospho-Src kinases in the pSMAC (green) and the cSMAC (red) is depicted as a bar diagram. The data are from analysis of at least 48 IS-forming cells of 2 independent experiments. The number of signaling clusters (E) and the amount of activated Src kinases per cluster (F) at the synapse formed by CD8+ and CD4+ CTL. Top panels: Comparison of CD4+ and CD8+ CTL exposed to bilayers containing respective cognate pMHC complexes and ICAM-1. Bottom panels: Comparison of CD8+ CTL CER43 exposed to bilayers containing either intact cognate GL9-HLA-A2 or GL9-HLA-A2(A245V) complexes plus ICAM-1. Data shown is from 12 IS-forming cells. Statistical analysis was performed by Student’s t-tests for paired data. #: P>0.25, *: P≤0.05.
Figure 3
Figure 3. Difference in the kinetics of early signaling in CD8+ and CD4+ CTL
(A) Time-dependent changes in intracellular calcium concentration in CER43 CD8+ CTL (top panel) and AC-25 CD4+ CTL (bottom panel) induced by cognate QD-520/GL9-HLA-A2 and QD-520/PP16-DR1 conjugates, respectively, at indicated concentrations. Controls (green) show changes in intracellular calcium in the CTL in the presence of 100 nM of non-cognate QD-520/pMHC conjugates. The results of representative experiments are shown. (B) Difference in the kinetics and magnitude of Ca2+ flux in 68A62 CD8+ CTL induced by QD-620 bearing either strong (IV9-HLA-A2, top panel) or weak (IV9-A7-HLA-A2, bottom panel) agonists at indicated concentrations. The results of representative experiments are shown.
Figure 4
Figure 4. Effect of receptor-independent alterations in intracellular calcium accumulation on the distribution of granules at the cytolytic synapses
(A) BAPTA treatment of CD8+ CTL prior to stimulation with QD-620 bearing strong agonist pMHC ligands significantly delayed the kinetics of intracellular Ca2+ accumulation. Black arrow indicates time points at which QD/pMHCs were added. Colored arrows indicate the times at which Ca2+ flux approached maximum at various BAPTA concentrations (depicted in the panel). (B) Ionomycin rapidly induces calcium influx in CD8+ CTL in a dose-dependent manner. Ionomycine concentrations are indicated. Ca2+ flux induced by cognate QD(620)/pMHC conjugates at 10 nM is shown as a positive control. Black arrow indicates time point at which ionomycin or QD/pMHCs were added. (C) Treatment with BAPTA at 10 μM significantly decreased the amount of granules in the cSMAC of 68A62 CD8+ CTL on bilayers containing ICAM-1 and strong agonist pMHC (IV9-HLA-A2) at 25 molecules/μm2 (upper panels). ICAM-1 is blue and granules are red. Scale bar: 5μm. The percentage of granules localized in the pSMAC (blue), cSMAC (red), and pSMAC/cSMAC junction (green) at the bilayer level is shown at the bottom panel. At least 10 IS forming cells from 2 independent experiments at the indicated time points were analyzed. (D) Stimulation of 68A62 CD8+ CTL exposed to ICAM-1-containing bilayers with IV9-A7-HLA-A2 weak agonist at 1 μM plus 1 μM ionomycin resulted in repositioning of the polarized granules to the cSMAC of the synapse. Representative images of two cells show granule positioning (red) relative to the ring junction (blue) in 68A62 CD8+ CTL in the presence (left panel) or absence (right panel) of ionomycin. At least 15 cells of each category from 2 independent experiments were analyzed. Scale bar: 5μm.
Figure 5
Figure 5. Temporal balance between the two principal movements determines the granule polarization pattern
(A). Representative images of granules (red) and Golgi complex (green) in AC-25 CD4+ and CER43 CD8+ CTL interacting with bilayers containing either cognate or non-cognate pMHC alone are shown. Three sequential z-stack images located in the middle of the cells, in which the Golgi complex staining was most prominent, are shown for each CTL. The majority of CD4+ and CD8+ CTL (50–70%) exposed to cognate pMHC concentrate most of their granules near the Golgi complex (top images), while 85–90% of the CTL exposed to non-cognate pMHC do not (bottom images). Scale bar: 5 μm. A cartoon depicts the CTL interacting with a bilayer containing cognate pMHC proteins only. Z-sections were acquired at 1 μm intervals through the cell volume beginning at the bilayer level. The MTOC location in the middle sections indicates that the MTOC was not polarized. (B). Increasing the strength of TCR stimulation after mature synapse formation does not promote granule accumulation in the cSMAC. Polarized granules (red) in 68A62 CD8+ CTL exposed to bilayers containing unlabeled weak agonist pMHC (500 molecules/μm2) and ICAM-1 (blue) are recruited to the periphery of the cytolytic synapse (left panel). Alexa Fluor 488-labeled strong agonist pMHC (green) was then flowed into the bilayers at 1 μM and accumulated in the cSMAC, but failed to induce the central location of polarized granules (middle panel). In control experiments, CTL exposure to bilayers that were initially loaded with weak agonist pMHC and ICAM-1 and then modified by the addition of strong agonist pMHC resulted in the recruitment of the strong agonist and the granules to the cSMAC (right panel). One representative cell of 9–12 analyzed cells in each category from 2 experiments is shown. Scale bar 5 μm.
Figure 6
Figure 6. Kinetics of granule release into the secretory domain of more (CD8+) and less (CD4+) effective CTL
(A) Representative TIRF images of a CER43 CD8+ and AC-25 CD4+ CTL interacting with bilayers containing the respective cognate pMHC proteins demonstrate the difference in the kinetics of granule release. Granules (CD107a): red, ICAM-1: green. Scale bar: 5μm. (B) The graphs show the percentage of CD107a positive CTL interacting with bilayers containing ICAM-1 and cognate pMHC at a density of either 500 molecules/μm2 (left) or 25 molecules/μm2 (right) as a function of time. Blue: CD8+ CTL, red: CD4+ CTL. More than 20 cells from at least 2 independent experiments were analyzed in each case. Statistical analysis was performed by Student’s t-tests. *: P<0.05.
Figure 7
Figure 7. Downstream Ca2+-dependent signaling influences the balance between the long and the short paths of granule delivery
The stronger early TCR signaling is initiated by a greater number of activated signaling proteins per microcluster and leads to rapid kinetics of intracellular Ca2+ accumulation, while a weaker early signaling does not. Rising the concentration of intracellular Ca2+ results in the activation of downstream signaling that regulates granule movement to the MTOC. In contrast, MTOC translocation is Ca2+-independent and is primarily mediated by DAG-dependent signaling. A faster Ca2+ signaling in more effective CTL stimulates swift granule movement towards the MTOC and the granules are concentrated near the MTOC prior to MTOC polarization. The MTOC then directly delivers granules to the secretory domain – the short path. A slower Ca2+ signaling in less effective CTL results in a delay in granule recruitment and granules move along the microtubules to the periphery of the synapse looping through the pSMAC – a longer path. MTOC polarization to the mature synapse also requires F-actin remodeling and segregation as well as the recruitment of ADAP-associated dynein to the periphery of the actin ring. Vav-dependent downstream signaling plays a critical role in regulating these molecular events. Cartoons at the upper and bottom left are courtesy of Christoph Schmutte.

Comment in

Similar articles

Cited by

References

    1. Anikeeva N, Lebedeva T, Clapp AR, Goldman ER, Dustin ML, Mattoussi H, Sykulev Y. Quantum dot/peptide-MHC biosensors reveal strong CD8-dependent cooperation between self and viral antigens that augment the T cell response. Proc Natl Acad Sci U S A. 2006;103:16846–16851. - PMC - PubMed
    1. Anikeeva N, Mareeva T, Liu W, Sykulev Y. Can oligomeric T-cell receptor be used as a tool to detect viral peptide epitopes on infected cells? Clin Immunol. 2009;130:98–109. - PMC - PubMed
    1. Anikeeva N, Somersalo K, Sims TN, Thomas VK, Dustin ML, Sykulev Y. Distinct role of lymphocyte function-associated antigen-1 in mediating effective cytolytic activity by cytotoxic T lymphocytes. Proc Natl Acad Sci U S A. 2005;102:6437–6442. - PMC - PubMed
    1. Appay V, Zaunders JJ, Papagno L, Sutton J, Jaramillo A, Waters A, Easterbrook P, Grey P, Smith D, McMichael AJ, et al. Characterization of CD4(+) CTLs ex vivo. J Immunol. 2002;168:5954–5958. - PubMed
    1. Beal AM, Anikeeva N, Varma R, Cameron TO, Norris PJ, Dustin ML, Sykulev Y. Protein kinase Ctheta regulates stability of the peripheral adhesion ring junction and contributes to the sensitivity of target cell lysis by CTL. J Immunol. 2008;181:4815–4824. - PMC - PubMed

Publication types

MeSH terms