. 2010 Feb 1;49(3):2416-32.
doi: 10.1016/j.neuroimage.2009.10.010. Epub 2009 Oct 13.

Validation of ICA-based myogenic artifact correction for scalp and source-localized EEG

Affiliations

Validation of ICA-based myogenic artifact correction for scalp and source-localized EEG

Brenton W McMenamin et al. Neuroimage. .

Abstract

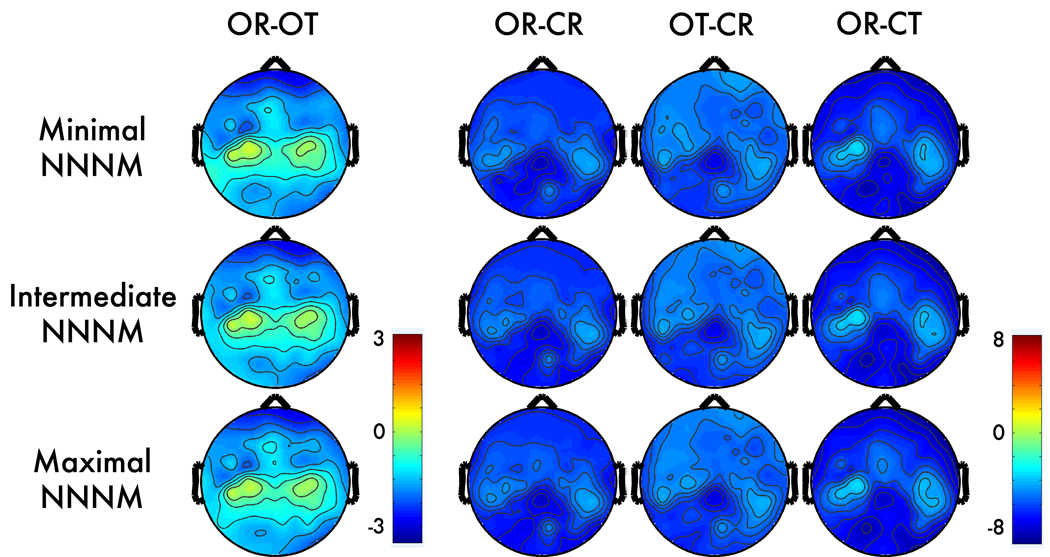
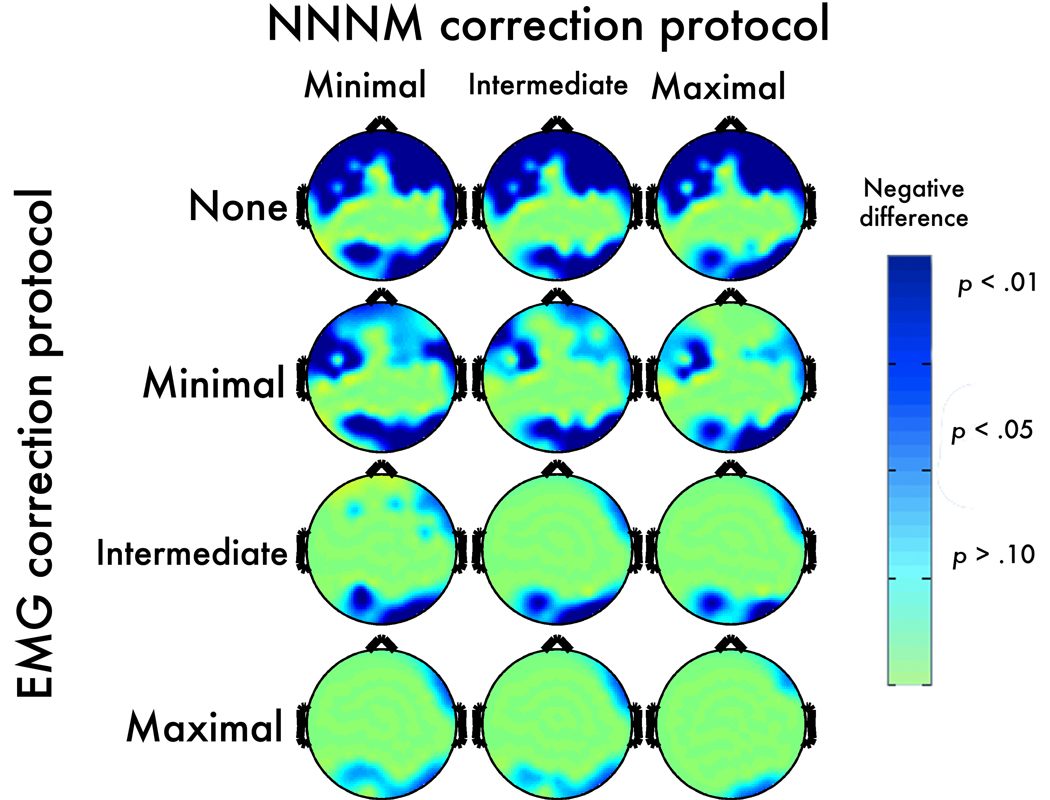
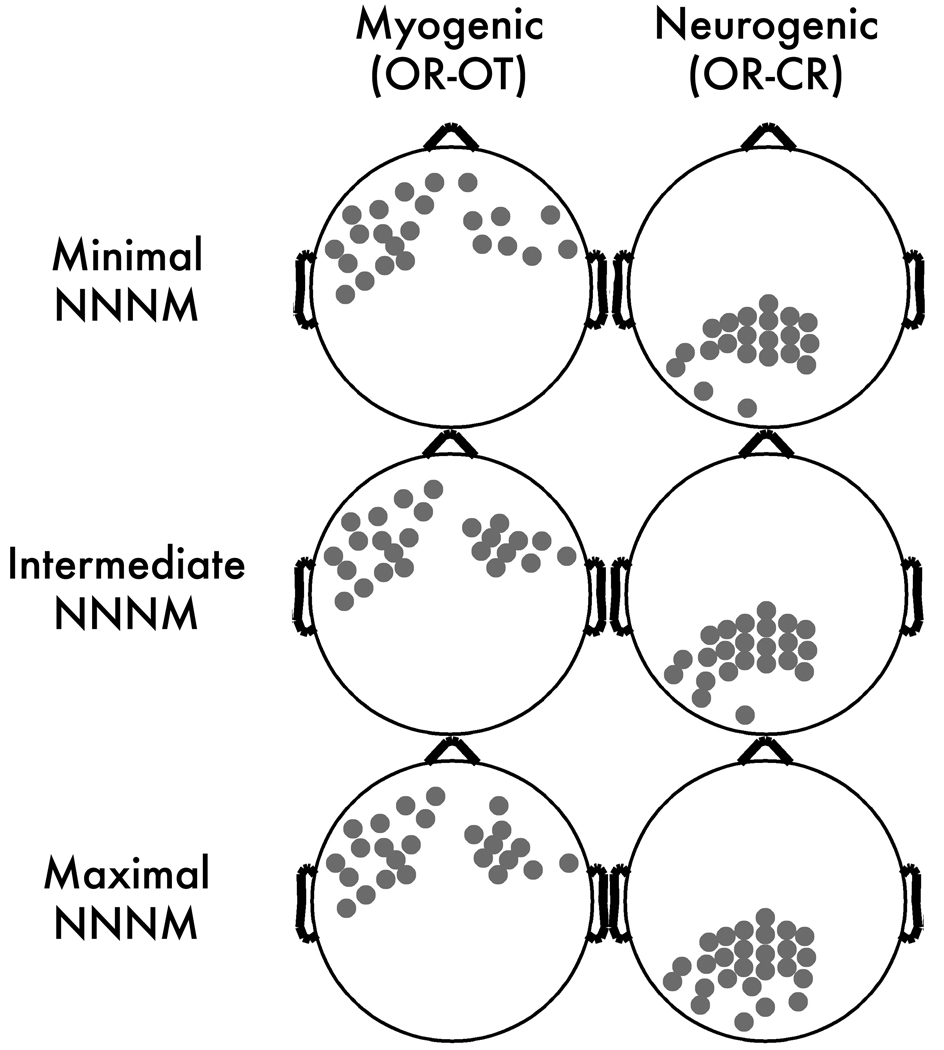
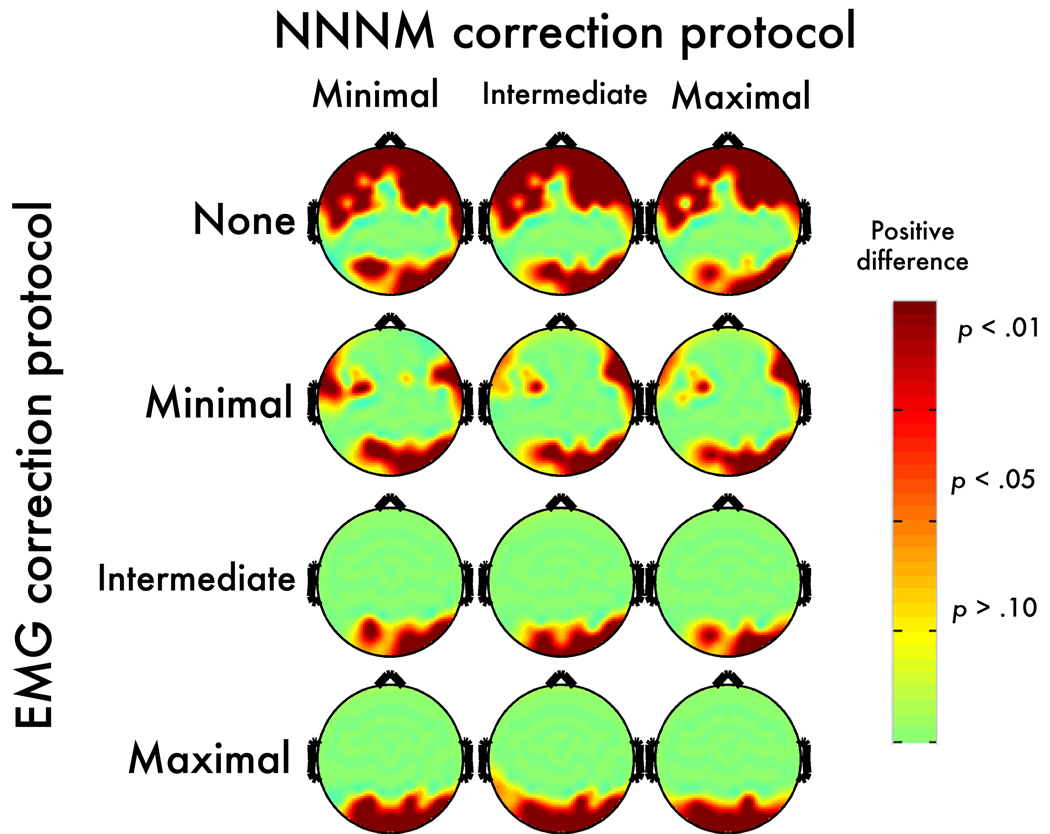
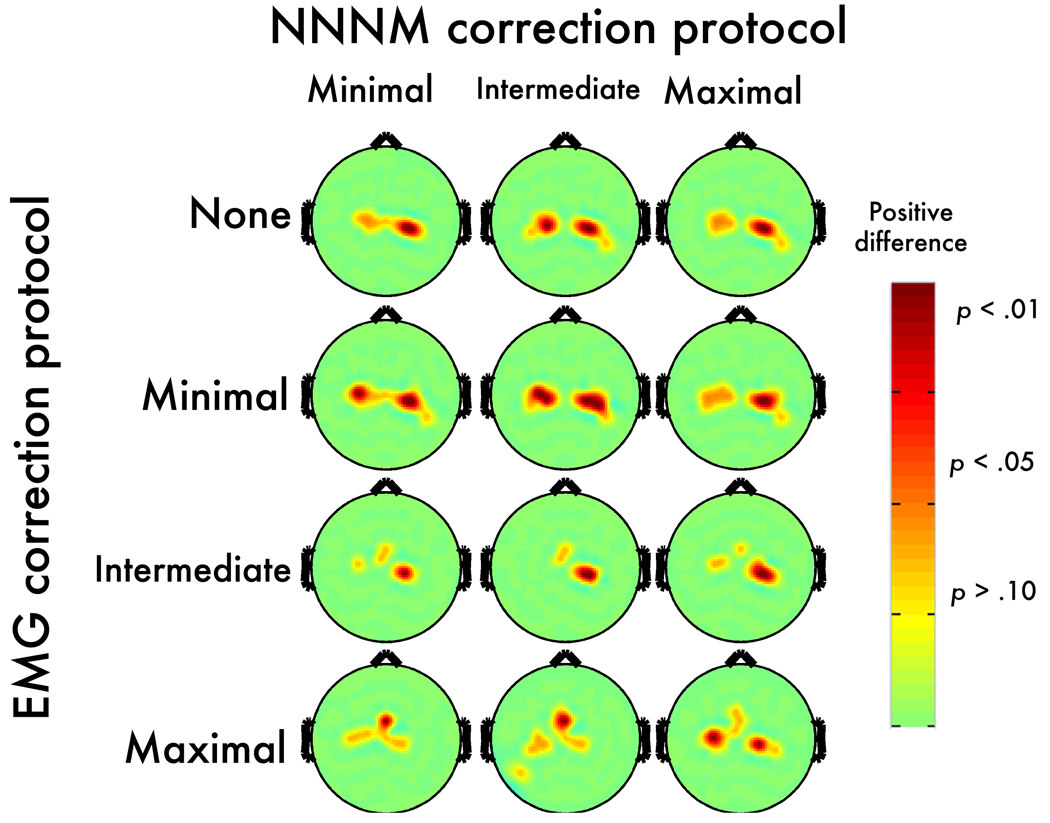
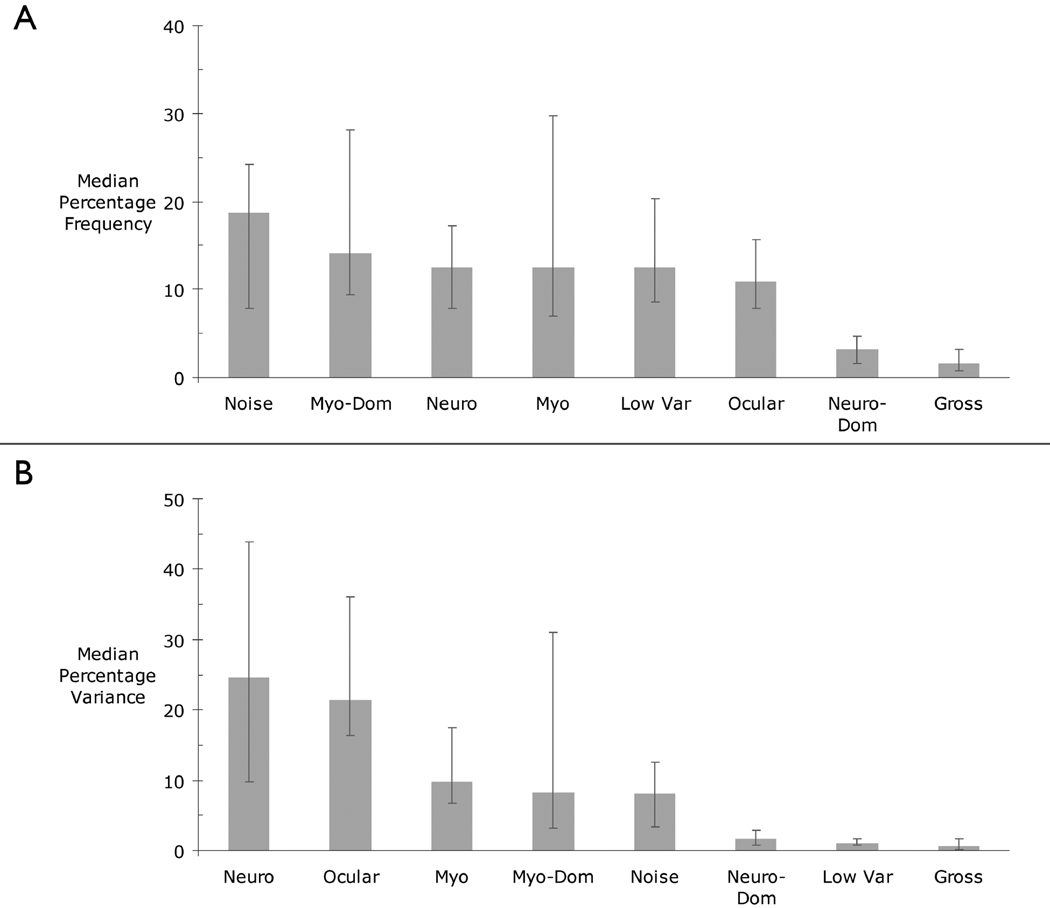
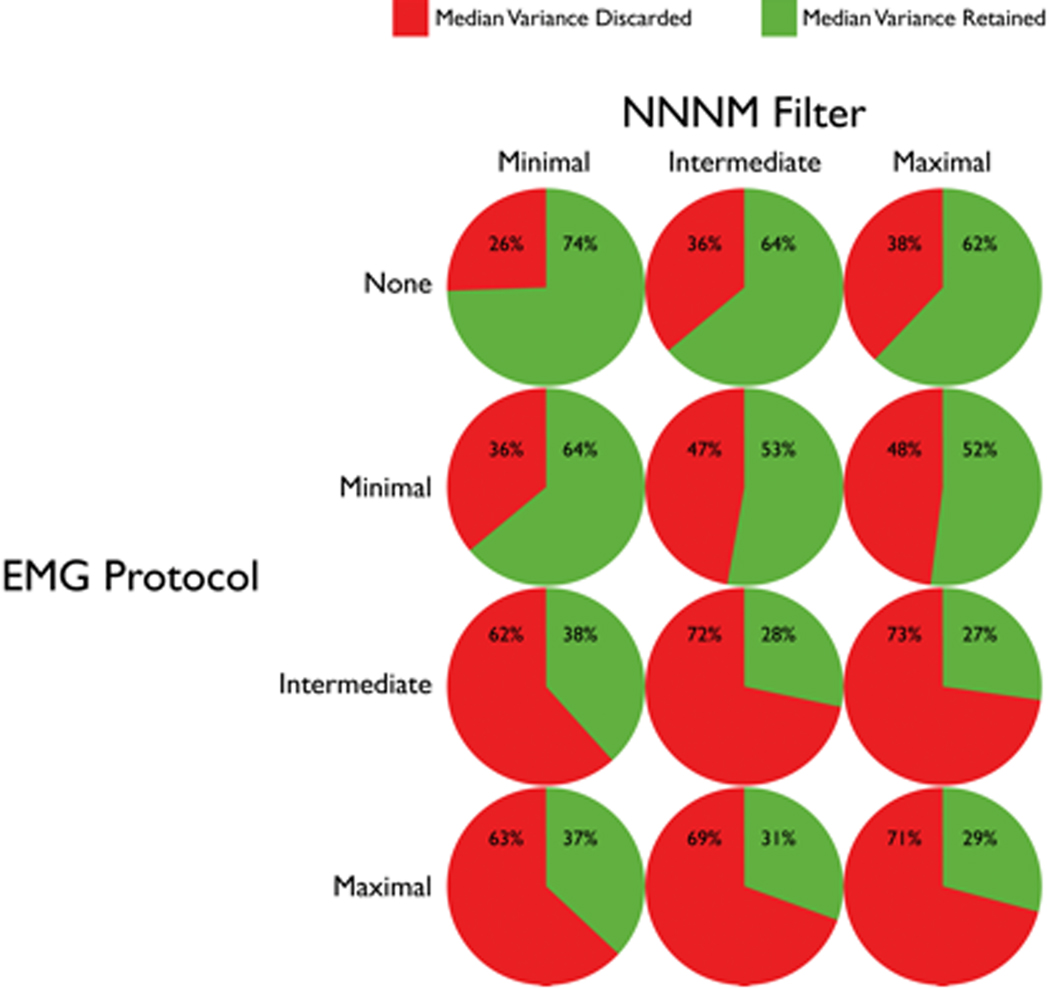
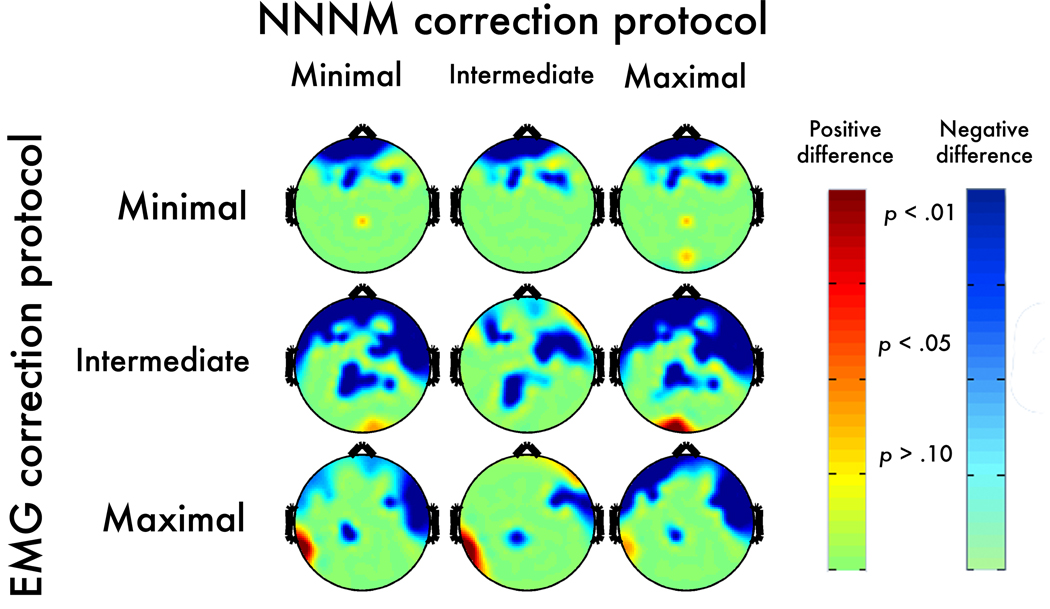
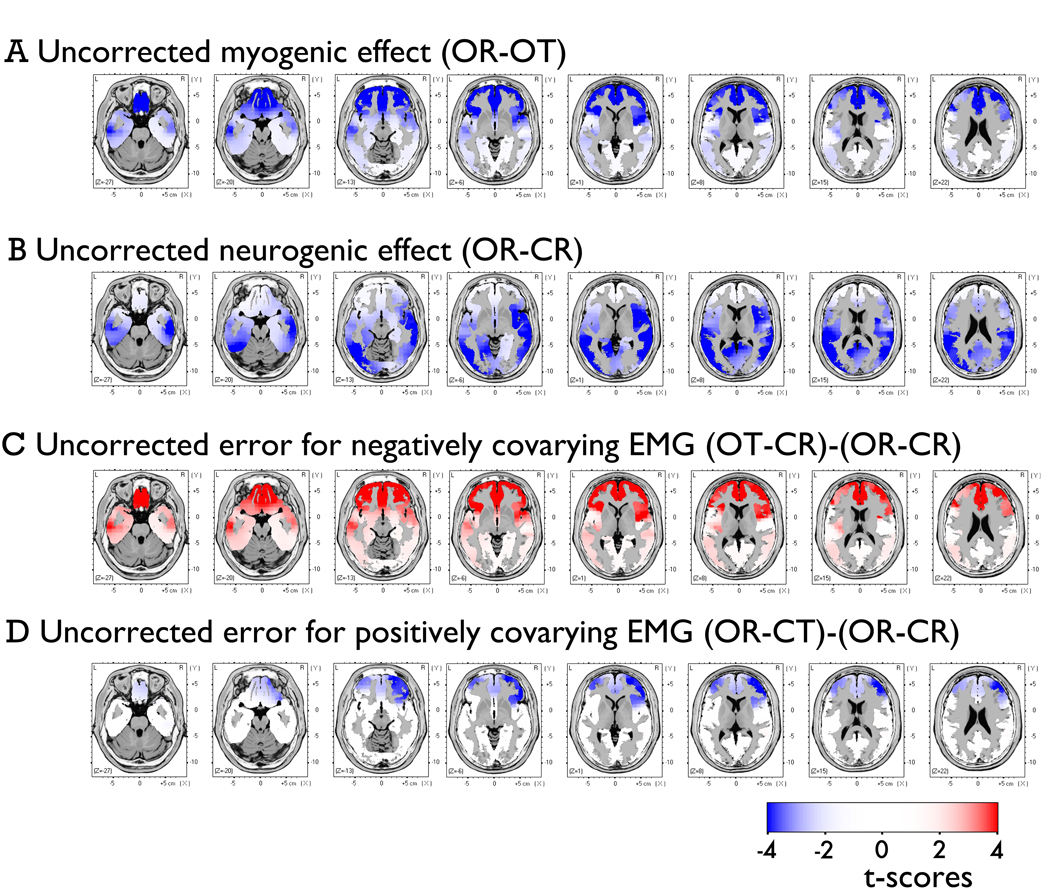
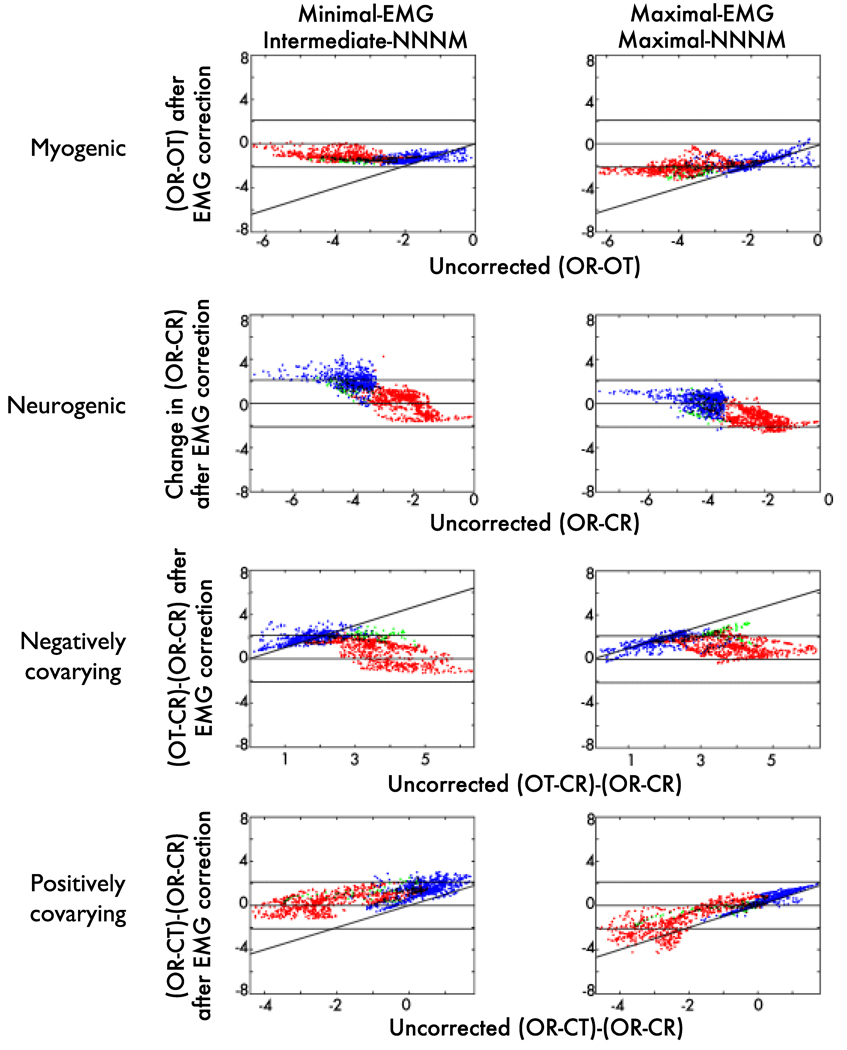
Muscle electrical activity, or "electromyogenic" (EMG) artifact, poses a serious threat to the validity of electroencephalography (EEG) investigations in the frequency domain. EMG is sensitive to a variety of psychological processes and can mask genuine effects or masquerade as legitimate neurogenic effects across the scalp in frequencies at least as low as the alpha band (8-13 Hz). Although several techniques for correcting myogenic activity have been described, most are subjected to only limited validation attempts. Attempts to gauge the impact of EMG correction on intracerebral source models (source "localization" analyses) are rarer still. Accordingly, we assessed the sensitivity and specificity of one prominent correction tool, independent component analysis (ICA), on the scalp and in the source-space using high-resolution EEG. Data were collected from 17 participants while neurogenic and myogenic activity was independently varied. Several protocols for classifying and discarding components classified as myogenic and non-myogenic artifact (e.g., ocular) were systematically assessed, leading to the exclusion of one-third to as much as three-quarters of the variance in the EEG. Some, but not all, of these protocols showed adequate performance on the scalp. Indeed, performance was superior to previously validated regression-based techniques. Nevertheless, ICA-based EMG correction exhibited low validity in the intracerebral source-space, likely owing to incomplete separation of neurogenic from myogenic sources. Taken with prior work, this indicates that EMG artifact can substantially distort estimates of intracerebral spectral activity. Neither regression- nor ICA-based EMG correction techniques provide complete safeguards against such distortions. In light of these results, several practical suggestions and recommendations are made for intelligently using ICA to minimize EMG and other common artifacts.


Figures

Figure 1
Figure 1. Alpha-band contrasts prior to correction
Topographic maps depict spline-interpolated t-maps for each condition-contrast (columns) and non-neurogenic/non-myogenic (NNNM) artifact filter (rows). There were four conditions, reflecting the factorial manipulation of myogenic (Muscles: Relaxed, Tensed) and neurogenic activity (Eyes: Open, Closed). Contrasts were computed to isolate myogenic (OR - OT), neurogenic (OR - CR), positively-covarying (OT - CR), and negatively-covarying (OR - CT) activity. Note the less extreme values for the myogenic contrast (OR – OT; first column).
Figure 2
Figure 2. Myogenic contrast (OR-OT) after EMG correction
Topographic maps depict thresholded p-values at each electrode after applying each method of non-neurogenic/non-myogenic (NNNM) artifact filtering and ICA-based EMG correction. Negative values are depicted in blue (dark-blue: p < .05; light-blue: p < .10; green: p > .10). Note that the row labeled “None” depicts the thresholded OR-OT contrast from Figure 1.
Figure 3
Figure 3. Scalp regions of interest (ROIs)
Gray circles depict electrodes included in the ROIs.
Figure 4
Figure 4. Negatively-covarying contrast: Post-correction error
Topographic maps depict p-values corresponding to the corrected OT-CR minus uncorrected OR-CR contrast. Positive values, indicating an increase in magnitude for the contrast, are shown in red (dark-red: p < .05; light-red: p < .10; yellow: p > .10).
Figure 5
Figure 5. Positively covarying contrast: Post-correction error
Topographic maps depict p-values corresponding to the corrected OR-CT minus uncorrected OR-CR contrast. Positive values, indicating an increase in magnitude for the contrast, are shown in red (dark-red: p < .05; light-red: p < .10; yellow: p > .10).
Figure 6
Figure 6. A) Median frequency and B) variance (in percent) accounted for by each class of components
Frequencies and percentages were computed within participants. Medians were then computed across participants. Error bars indicate the 25th and 75th percentiles.
Figure 7
Figure 7. Median variance retained and discarded for each combination of NNNM filter and EMG correction protocol
Figure 8
Figure 8. Neurogenic contrast: Post-correction error
Topographic maps depict thresholded p-values corresponding to the corrected OR-CR minus uncorrected OR-CR contrast. Negative values, indicating an increase in magnitude for the neurogenic contrast, are shown in blue (dark-blue: p < .05; light-blue: p < .10; green: p > .10). Positive values, indicating correction-induced magnitude reduction of the neurogenic contrast, are shown in red (dark-red: p < .05; light-red: p < .10; yellow: p > .10).
Figure 9
Figure 9. Contrasts of interest in the source-space after applying the Intermediate-NNNM filter
A) Myogenic contrast (OR-OT), B) Neurogenic contrast (OR-CR), C) Error induced by negatively-covarying artifact prior to EMG correction ([OT-CR] minus [OR-CR]), and D) Error induced by positively-covarying artifact ([OR-CT] minus [OR-CR]) prior to EMG correction.
Figure 10
Figure 10. Source-space effects of EMG correction
Uncorrected (x-axis) compared to ICA-corrected t-values (y-axis) for voxels in the source-space, color-coded by ROI (Blue: Neurogenic ROI; Red: Myogenic ROI; Green: Both ROIs). Points close to the solid horizontal line are voxels where t approached zero after correction, indicating high sensitivity for EMG-contaminated contrasts and low specificity for the EMG-free neurogenic contrast. Conversely, points lying beyond the broken horizontal lines (p = .05) were significantly altered by correction. Points along the diagonal were unchanged by correction, indicating low sensitivity for EMG-contaminated contrasts and high specificity for the neurogenic contrast. Note that row B plots the uncorrected OR-CR contrast (x-axis) against the change in OR-CR after correction (i.e. correction induced error; y-axis).

Comment in

Similar articles

Cited by

References

    1. Allen JJB, Coan JA, Nazarian M. Issues and assumptions on the road from raw signals to metrics of frontal EEG asymmetry in emotion. Biological Psychology. 2004;67:183–218. - PubMed
    1. Anemuller J, Sejnowski TJ, Makeig S. Complex independent component analysis of frequency-domain electroencephalographic data. Neural Networks. 2003;16:1311–1323. - PMC - PubMed
    1. Anemuller J, Sejnowski TJ, Makeig S. Reliable measurement of cortical flow patterns using complex independent component analysis of electroencephalographic signals. Lecture Notes in Computer Science. 2004;3195:1009–1016.
    1. Beckmann CF, Smith SM. Probabilistic independent component analysis for functional magnetic resonance imaging. IEEE Transactions on Medical Imaging. 2004;23:137–152. - PubMed
    1. Bell AJ, Sejnowski TJ. An information-maximization approach to blind separation and blind deconvolution. Neural Computation. 1995;7:1004–1034. - PubMed

Publication types

LinkOut - more resources