

Relationship between baseline coronary calcium score and demonstration of coronary artery stenoses during follow-up MESA (Multi-Ethnic Study of Atherosclerosis)
- PMID: 19833306
- PMCID: PMC2803053
- DOI: 10.1016/j.jcmg.2009.06.014
Relationship between baseline coronary calcium score and demonstration of coronary artery stenoses during follow-up MESA (Multi-Ethnic Study of Atherosclerosis)
Abstract
Objectives: The MESA (Multi-Ethnic Study of Atherosclerosis) is a population-based study of 6,814 men and women. We sought to analyze the relationship between the extent of coronary artery calcium (CAC) at baseline and the severity of coronary stenoses in clinically indicated coronary angiography studies during follow-up.
Background: CAC is an established predictor of major cardiovascular events. Yet, the relationship between CAC and the distribution and severity of coronary artery stenoses has not been widely explored.
Methods: All MESA participants underwent noncontrast enhanced cardiac computed tomography during enrollment to determine baseline CAC. We analyzed 175 consecutive angiography reports from participants who underwent coronary catheterization for clinical indications during a median follow-up period of 18 months. The relationship between baseline CAC and the severity of coronary stenosis detected in coronary angiographies was determined.
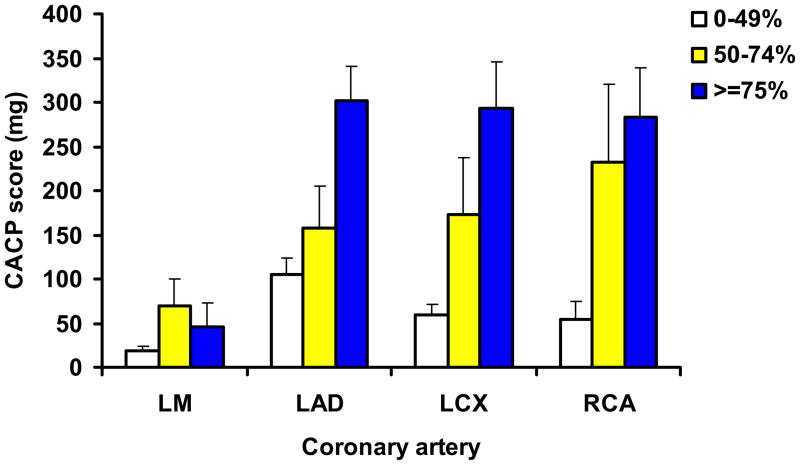
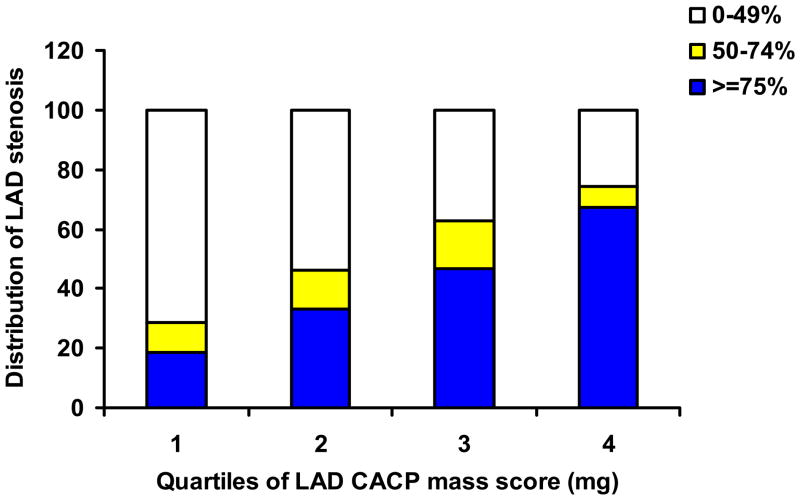
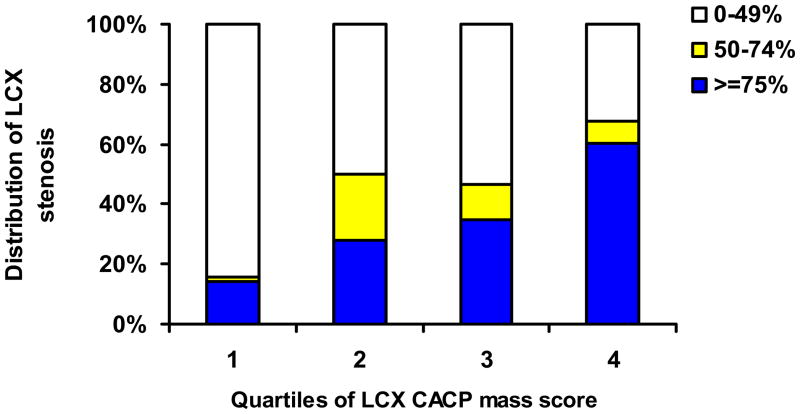
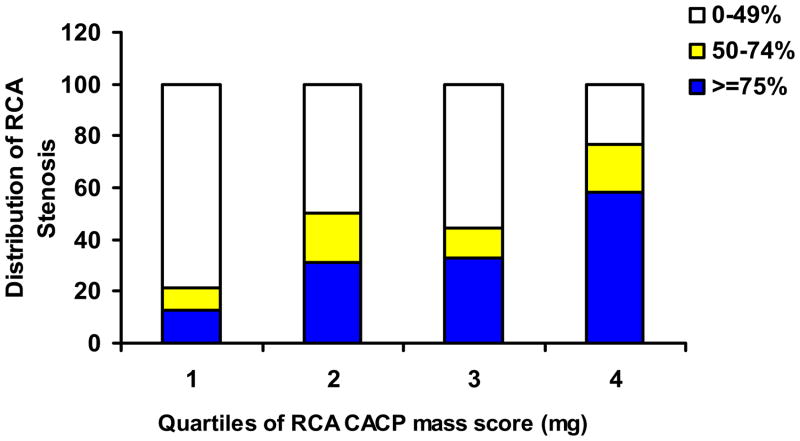
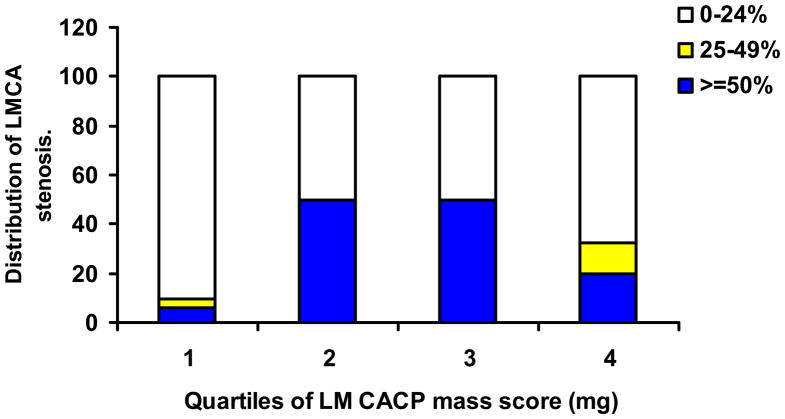
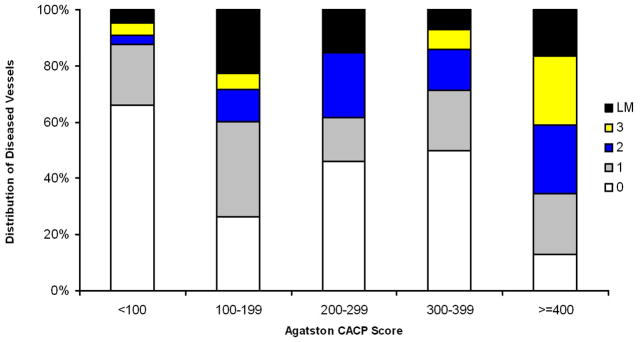
Results: Baseline Agatston score was 0 in only 7 of 175 (4%) MESA participants who underwent invasive angiography during follow-up. When coronary arteries were studied separately, 13% to 18% of coronary arteries with >or=75% stenosis had 0 calcium mass scores at baseline. There was close association between baseline calcium mass score and the severity of stenosis in each of the coronary arteries (test for trend, p < 0.001). For example, mean calcium mass scores for <50%, 50% to 74%, and >or=75% stenosis in the left anterior descending coronary artery were 105.1 mg, 157.2 mg, and 302.2 mg, respectively (p < 0.001). Finally, there was a direct relationship between the total Agatston Score at baseline and the number of diseased vessels (test for trend, p < 0.001).
Conclusions: The majority of patients with clinically indicated coronary angiography during follow-up had detectable coronary calcification at baseline. Although there is a significant relationship between the extent of calcification and mean degree of stenosis in individual coronary vessels, 16% of the coronary arteries with significant stenoses had no calcification at baseline.
Conflict of interest statement
Reynolds Center. There are no conflicts of interest.
Figures

Comment in
-
Coronary artery calcium: the cup is 96% full.JACC Cardiovasc Imaging. 2009 Oct;2(10):1184-6. doi: 10.1016/j.jcmg.2009.03.024. JACC Cardiovasc Imaging. 2009. PMID: 19833307 No abstract available.
Similar articles
-
Coronary artery calcium: the cup is 96% full.JACC Cardiovasc Imaging. 2009 Oct;2(10):1184-6. doi: 10.1016/j.jcmg.2009.03.024. JACC Cardiovasc Imaging. 2009. PMID: 19833307 No abstract available.
-
10-Year Coronary Heart Disease Risk Prediction Using Coronary Artery Calcium and Traditional Risk Factors: Derivation in the MESA (Multi-Ethnic Study of Atherosclerosis) With Validation in the HNR (Heinz Nixdorf Recall) Study and the DHS (Dallas Heart Study).J Am Coll Cardiol. 2015 Oct 13;66(15):1643-53. doi: 10.1016/j.jacc.2015.08.035. J Am Coll Cardiol. 2015. PMID: 26449133 Free PMC article.
-
Spatially Weighted Coronary Artery Calcium Score and Coronary Heart Disease Events in the Multi-Ethnic Study of Atherosclerosis.Circ Cardiovasc Imaging. 2021 Jan;14(1):e011981. doi: 10.1161/CIRCIMAGING.120.011981. Epub 2021 Jan 19. Circ Cardiovasc Imaging. 2021. PMID: 33461306 Free PMC article.
-
Baseline subclinical atherosclerosis burden and distribution are associated with frequency and mode of future coronary revascularization: multi-ethnic study of atherosclerosis.JACC Cardiovasc Imaging. 2014 May;7(5):476-486. doi: 10.1016/j.jcmg.2014.03.005. JACC Cardiovasc Imaging. 2014. PMID: 24831208 Free PMC article.
-
Legacy of MESA.Glob Heart. 2016 Sep;11(3):269-274. doi: 10.1016/j.gheart.2016.08.004. Glob Heart. 2016. PMID: 27741974 Free PMC article. Review.
Cited by
-
Impact of Zero Coronary Artery Calcium Scoring on Downstream Cardiac Testing and Cardiac Outcomes Compared With No Testing.CJC Open. 2024 Nov 19;7(2):211-220. doi: 10.1016/j.cjco.2024.11.009. eCollection 2025 Feb. CJC Open. 2024. PMID: 40060215 Free PMC article.
-
A zero coronary artery calcium score in patients with stable chest pain is associated with a good prognosis, despite risk of non-calcified plaques.Open Heart. 2019 Apr 11;6(1):e000945. doi: 10.1136/openhrt-2018-000945. eCollection 2019. Open Heart. 2019. PMID: 31168373 Free PMC article.
-
Approach to risk stratification of atherosclerotic cardiovascular disease: Use of biomarkers and imaging in a Canadian context.Can Fam Physician. 2022 Sep;68(9):654-660. doi: 10.46747/cfp.6809654. Can Fam Physician. 2022. PMID: 36100373 Free PMC article.
-
Coronary Artery Calcification.Glob Heart. 2016 Sep;11(3):287-293. doi: 10.1016/j.gheart.2016.08.001. Glob Heart. 2016. PMID: 27741976 Free PMC article. Review.
-
Cardiac risk stratification: role of the coronary calcium score.Vasc Health Risk Manag. 2010 Aug 9;6:603-11. doi: 10.2147/vhrm.s8753. Vasc Health Risk Manag. 2010. PMID: 20730016 Free PMC article. Review.
References
-
- Naghavi M, Falk E, Hecht HS, Jamieson MJ, Kaul S, Berman D, Fayad Z, Budoff MJ, Rumberger J, Naqvi TZ, Shaw LJ, Faergeman O, Cohn J, Bahr R, Koenig W, Demirovic J, Arking D, Herrera VL, Badimon J, Goldstein JA, Rudy Y, Airaksinen J, Schwartz RS, Riley WA, Mendes RA, Douglas P, Shah PK. From vulnerable plaque to vulnerable patient--Part III: Executive summary of the Screening for Heart Attack Prevention and Education (SHAPE) Task Force report. Am J Cardiol. 2006;98:2H–15H. - PubMed
-
- Greenland P, Bonow RO, Brundage BH, Budoff MJ, Eisenberg MJ, Grundy SM, Lauer MS, Post WS, Raggi P, Redberg RF, Rodgers GP, Shaw LJ, Taylor AJ, Weintraub WS. ACCF/AHA 2007 clinical expert consensus document on coronary artery calcium scoring by computed tomography in global cardiovascular risk assessment and in evaluation of patients with chest pain: a report of the American College of Cardiology Foundation Clinical Expert Consensus Task Force (ACCF/AHA Writing Committee to Update the 2000 Expert Consensus Document on Electron Beam Computed Tomography) developed in collaboration with the Society of Atherosclerosis Imaging and Prevention and the Society of Cardiovascular Computed Tomography. J Am Coll Cardiol. 2007;49:378–402. - PubMed
-
- Forrester JS. Prevention of plaque rupture: a new paradigm of therapy. Ann Intern Med. 2002;137:823–833. - PubMed
-
- Schmermund A, Erbel R. Unstable coronary plaque and its relation to coronary calcium. Circulation. 2001;104:1682–1687. - PubMed
-
- Mautner GC, Mautner SL, Froehlich J, Feuerstein IM, Proschan MA, Roberts WC, Doppman JL. Coronary artery calcification: assessment with electron beam CT and histomorphometric correlation. Radiology. 1994;192:619–623. - PubMed
Publication types
MeSH terms
Grants and funding
- R01 HL066075/HL/NHLBI NIH HHS/United States
- ZIA CL090019/ImNIH/Intramural NIH HHS/United States
- N01 HC095168/HL/NHLBI NIH HHS/United States
- N01 HC095169/HL/NHLBI NIH HHS/United States
- N01-HC-95168/HC/NHLBI NIH HHS/United States
- N01-HC-95159/HC/NHLBI NIH HHS/United States
- N01 HC095159/HL/NHLBI NIH HHS/United States
- R01-HL66075-01/HL/NHLBI NIH HHS/United States
- N01-HC-95169/HC/NHLBI NIH HHS/United States
- Z99 CL999999/ImNIH/Intramural NIH HHS/United States
- N01 HC095166/HL/NHLBI NIH HHS/United States
- R01-HL6607-01/HL/NHLBI NIH HHS/United States
- N01 HC095162/HL/NHLBI NIH HHS/United States
- N01-HC-95166/HC/NHLBI NIH HHS/United States
- ZIA EB000072/ImNIH/Intramural NIH HHS/United States
LinkOut - more resources
Full Text Sources
Medical
Molecular Biology Databases
