

Non-genetic cell-to-cell variability and the consequences for pharmacology
- PMID: 19833543
- PMCID: PMC2975492
- DOI: 10.1016/j.cbpa.2009.09.015
Non-genetic cell-to-cell variability and the consequences for pharmacology
Abstract
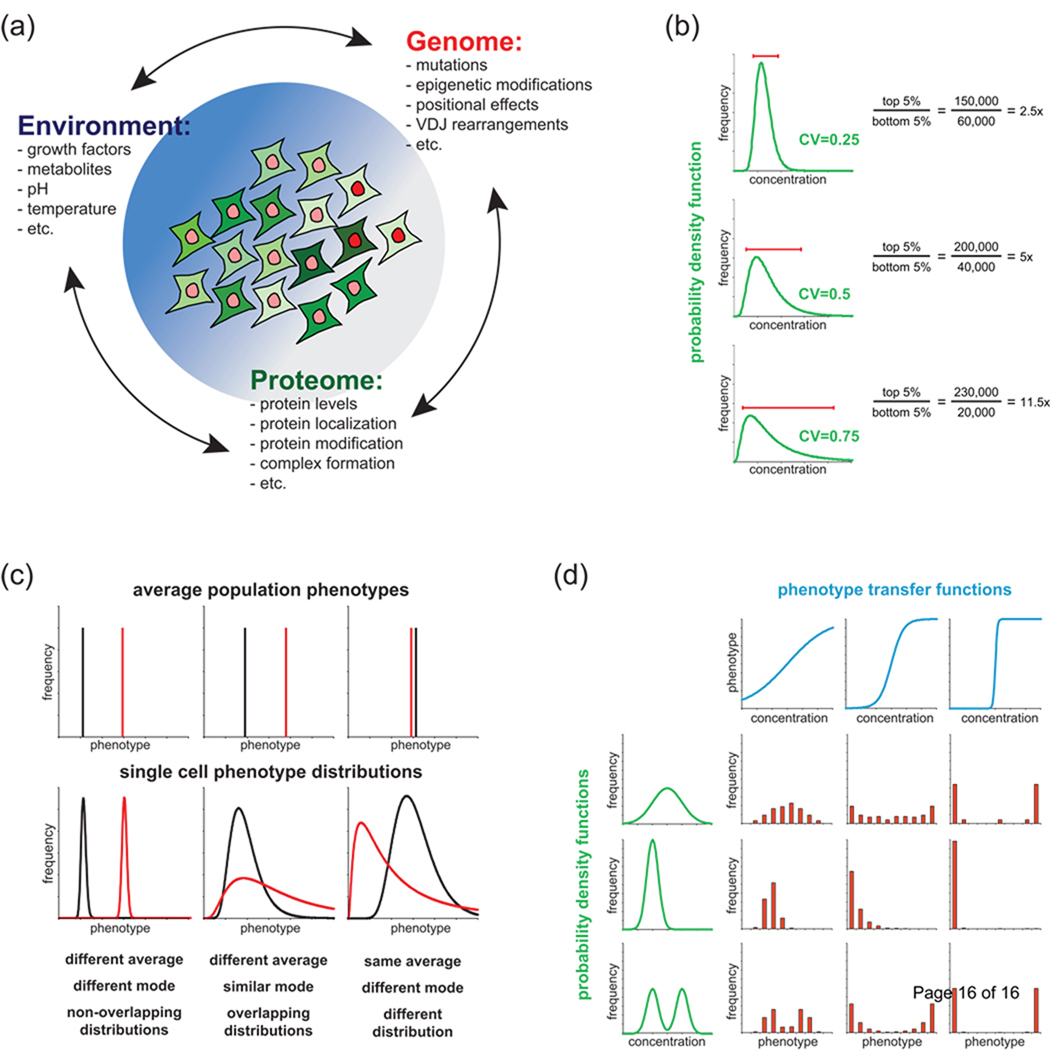
Recent advances in single-cell assays have focused attention on the fact that even members of a genetically identical group of cells or organisms in identical environments can exhibit variability in drug sensitivity, cellular response, and phenotype. Underlying much of this variability is stochasticity in gene expression, which can produce unique proteomes even in genetically identical cells. Here we discuss the consequences of non-genetic cell-to-cell variability in the cellular response to drugs and its potential impact for the treatment of human disease.
Figures
References
-
-
Feinerman O, Veiga J, Dorfman JR, Germain RN, Altan-Bonnet G. Variability and robustness in T cell activation from regulated heterogeneity in protein levels. Science. 2008;321:1081–1084.. ** This study linked variability in the activation of a clonal population of T cells to endogenous variability in the levels of two proteins, CD8 and SHP-1. The authors measured co-variation in the levels of these two proteins and using modeling, showed that this co-variation reduced the diversity of T cell response.
-
-
-
Gascoigne KE, Taylor SS. Cancer cells display profound intra- and interline variation following prolonged exposure to antimitotic drugs. Cancer Cell. 2008;14:111–122.. ** This paper characterized the response of 15 cell lines to three different classes of antimitotic drugs and found significant inter- as well as intra-line variation, with cells within any given cell line exhibiting multiple distinct phenotypes in response to treatment.
-
-
-
Spencer SL, Gaudet S, Albeck JG, Burke JM, Sorger PK. Non-genetic origins of cell-to-cell variability in TRAIL-induced apoptosis. Nature. 2009;459:428–432.. * This paper examined why, in a clonal population, some cells die after a death-inducing stimulus, while others survive indefinitely. Using time-lapse imaging, flow cytometry, and mathematical modeling, the authors showed that stochastic differences in the levels of proteins are the primary causes of cell-to-cell variability in the timing and probability of death.
-
Publication types
MeSH terms
Substances
Grants and funding
LinkOut - more resources
Full Text Sources
Other Literature Sources
