. 2009 Nov;20(11):2389-402.
doi: 10.1681/ASN.2008040435. Epub 2009 Oct 15.

Pkd1 haploinsufficiency increases renal damage and induces microcyst formation following ischemia/reperfusion

Affiliations

Pkd1 haploinsufficiency increases renal damage and induces microcyst formation following ischemia/reperfusion

Ana P Bastos et al. J Am Soc Nephrol. 2009 Nov.

Erratum in

  • J Am Soc Nephrol. 2010 Jun;21(6):1062

Abstract

Mutations in PKD1 cause the majority of cases of autosomal dominant polycystic kidney disease (ADPKD). Because polycystin 1 modulates cell proliferation, cell differentiation, and apoptosis, its lower biologic activity observed in ADPKD might influence the degree of injury after renal ischemia/reperfusion. We induced renal ischemia/reperfusion in 10- to 12-wk-old male noncystic Pkd1(+/-) and wild-type mice. Compared with wild-type mice, heterozygous mice had higher fractional excretions of sodium and potassium and higher serum creatinine after 48 h. In addition, in heterozygous mice, also cortical damage, rates of apoptosis, and inflammatory infiltration into the interstitium at time points out to 14 d after injury all increased, as well as cell proliferation at 48 h and 7 d. The mRNA and protein expression of p21 was lower in heterozygous mice than wild-type mice at 48 h. After 6 wk, we observed dilated tubules, microcysts, and increased renal fibrosis in heterozygotes. The early mortality of heterozygotes was significantly higher than that of wild-type mice when we extended the duration of ischemia from 32 to 35 min. In conclusion, ischemia/reperfusion induces a more severe injury in kidneys of Pkd1-haploinsufficient mice, a process that apparently depends on a relative deficiency of p21 activity, tubular dilation, and microcyst formation. These data suggest the possibility that humans with ADPKD from PKD1 mutations may be at greater risk for damage from renal ischemia/reperfusion injury.


Figures

Figure 1.
Figure 1.
(A and B) Comparative analyses of SCr (A) and BUN (B) in Pkd1+/+ and Pkd1+/− male mice before insult and 48 h, 7 d, and 14 d after a 32 min of renal IR insult. πP < 0.001 versus preischemic (PI); P < 0.05 versus PI; $P < 0.05 versus 48 h; θP < 0.005 versus Pkd1+/+. SCr was compared using two-way ANOVA, with the data presented as means ± SD, and BUN using the Friedmann test, with the data expressed as median (minimal to maximal).
Figure 2.
Figure 2.
(A and B) Comparative analyses of SCr (A) and BUN (B) in Pkd1+/+ (n = 11) and Pkd1+/− (n = 8) male mice before insult and 48 h after a 35 min of renal IR insult. ΔP < 0.0001 versus PI; £P < 0.0005 versus PI; ωP < 0.0003 versus Pkd1+/+; #P < 0.05 versus Pkd1+/+. SCr and BUN were compared using the nonpaired t test with Welch correction, with the data presented as means ± SD. The high mortality observed in the Pkd1+/− mice group beyond 48 h did not allow longer time evaluations. (C) Cumulative survival curves and comparative analysis between Pkd1+/+ and Pkd1+/− male mice after 35 min of IR (P < 0.0001). Comparison performed using the Kaplan-Meier survival curve.
Figure 3.
Figure 3.
(A) Comparative analysis of renal residual cortical damage evaluated by the Jablonski index in Pkd1+/+ and Pkd1+/− male mice 48 h, 7 d, and 14 d after renal IR (48 h n = 10 per group; 7 d n = 8 per group; 14 d n = 8 per group). #P < 0.05 versus Pkd1+/+; *P < 0.0001 versus Pkd1+/+. Nonpaired t test, with the data expressed as means ± SD. (B) Histologic representation of renal injury in Pkd1+/+ (a, c, e, and g) and Pkd1+/− (b, d, f, and h) mice. (a and b) SO. (c and d) Forty-eight hours after IR. (e and f) Seven days. (g and h) Fourteen days. Magnification, ×400.
Figure 4.
Figure 4.
Immunoelectron microscopy analysis in Pkd1+/+ and Pkd1+/− male mice 48 h after renal IR. (A) Representative images of PTs in Pkd1+/+ (a and b) and Pkd1+/− (c and d) mice. WT controls show mild alterations whereas HTs show significant tubular cell damage with intraluminal hyaline casts (*) and shedding of lining cells with increased amounts of protein in the lumen of PTs. Some HT tubular cells showed rarefaction of the cytoplasm with intracellular vacuoles, swollen organelles, apoptosis, and loss of brush border (arrows), whereas others presented nuclear condensation, cytoplasmic swelling, and loss of nuclei in up to one third of the tubular profile. (B) Representative images of peritubular capillaries in Pkd1+/+ (a and b) and Pkd1+/− (c and d) mice. HTs show a significantly more severe loss of peritubular capillary endothelial fenestration, as well as accumulation of flocculent material. Magnifications: ×10,000 in A and B (b); ×20, 000 in B (a, c, and d).
Figure 5.
Figure 5.
(A) Comparative analysis of kidney PCNA staining in Pkd1+/+ and Pkd1+/− male mice after 48 h, 7 d, and 14 d of renal IR (48 h n = 10 per group; 7 d n = 8 per group; 14 d n = 8 per group). *P < 0.0001 versus Pkd1+/+. χ2 proportion test, with the data presented as median (lower quartile to upper quartile). (B) Representative images of PCNA staining in Pkd1+/+ (a, c, e, and g) and Pkd1+/− (b, d, f, and h) mice. (a and b) SO. (c and d) Forty-eight hours after IR. (e and f) Seven days. (g and h) Fourteen days. Magnification, ×400.
Figure 6.
Figure 6.
(A) Comparative analysis of TUNEL staining in kidneys of Pkd1+/+ and Pkd1+/− male mice at 48 h, 7 d, and 14 d of follow-up after renal IR (48 h n = 10 per group; 7d n = 8 per group; 14 d n = 8 per group). P < 0.0005 versus Pkd1+/+; **P < 0.01 versus Pkd1+/+; θP < 0.005 versus Pkd1+/+. χ2 proportion test, with the data expressed as median (lower quartile to upper quartile). (B) Representative images of TUNEL staining in Pkd1+/+ (a, c, e, g, i, k, m, and o) and Pkd1+/− (b, d, f, h, j, l, n, and p) mice. (a, b, c, and d) SO. (e, f, g, and h) Forty-eight hours after IR. (i, j, k, and l) Seven days. (m, n, o, and p) Fourteen days. Magnifications: ×400 in a, b, e, f, i, j, m, and n; ×1000 in c, d, g, h, k, l, o, and p.
Figure 7.
Figure 7.
(A) Comparative analysis of p21 staining in kidneys of Pkd1+/+ and Pkd1+/− male mice after 48 h and 7 d of renal IR (48 h n = 10 per group; 7 d n = 8 per group). P < 0.0005 versus Pkd1+/+; #P < 0.05 versus Pkd1+/+. χ2 proportion test, with the data expressed as median (lower quartile to upper quartile). (B) Representative images of p21 staining in Pkd1+/+ (a, c, e, g, i, and k) and Pkd1+/− (b, d, f, h, j, and l) mice. (a, b, c, and d) SO. (e, f, g, and h) Forty-eight hours after IR. (i, j, k, and l) Seven days. (m) Negative control in kidney. (n) Positive control in breast cancer. (C) Comparative analysis of p21 mRNA levels in Pkd1+/+ and Pkd1+/− kidneys of male mice 48 h after renal IR (n = 8 per group), performed by real-time RT-PCR. ϕP < 0.03 versus Pkd1+/+, t test with Welch correction. Magnifications: ×400 in B (a, b, e, f, i, j, m, and n); ×1000 in B (c, d, g, h, k, and l).
Figure 8.
Figure 8.
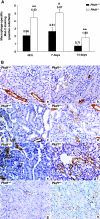
(A) Comparative analysis of kidney Mac-2 staining in Pkd1+/+ and Pkd1+/− male mice after 48 h, 7 d, and 14 d of renal IR (48 h n = 10 per group; 7 d n = 8 per group; 14 d n = 8 per group). **P < 0.01 versus Pkd1+/+; #P < 0.05 versus Pkd1+/+. Nonpaired t test, with the data expressed as means ± SD. (B) Representative images of Mac-2 staining in Pkd1+/+ (a, c, e, and g) and Pkd1+/− (b, d, f, and h) mice. (a and b) SO. (c and d) Forty-eight hours after IR. (e and f) Seven days. (g and h) Fourteen days. Magnification, ×400.
Figure 9.
Figure 9.
(A) Comparative analysis of relative area of interstitial expansion in Pkd1+/+ (n = 7) and Pkd1+/− (n = 7) male mice 6 wk after renal IR. ΩP < 0.005 versus SO; **P < 0.01 versus Pkd1+/+. Nonpaired Mann-Whitney test, with the data expressed as median (lower quartile to upper quartile). (B) Histologic representation in Pkd1+/+ (a, c, and e) and Pkd1+/− (b, d, and f) mice. (a and b) SO. (c, d, e, and f) Six weeks after IR. (C) Comparative analysis of Col1a1 and Col1a2 mRNA levels in Pkd1+/+ and Pkd1+/− kidneys of male mice 6 wk after renal IR (n = 6 per group), performed by real-time RT-PCR. P < 0.02 versus Pkd1+/+; ¥P < 0.0002 versus Pkd1+/+, t test with Welch correction. Magnification, ×400 in B.
Figure 10.
Figure 10.
(A) Comparative analysis of TD, MC formation index, and cyst formation index in Pkd1+/+ (n = 7) and Pkd1+/− (n = 7) male mice 6 wk after renal IR. ⊢oP < 0.02 versus SO; P < 0.05 versus SO; P < 0.02 versus Pkd1+/+. Nonpaired Mann-Whitney test, with the values expressed as median (lower quartile to upper quartile). (B) Histologic representation in Pkd1+/+ (a, c, and e) and Pkd1+/− (b, d, and f) mice. (a and b) SO. (c, d, e, and f) Six weeks after IR. Magnification, ×400 in a, b, c, and d; ×200 in e and f.

References

    1. Torres VE, Harris PC, Pirson Y: Autosomal dominant polycystic kidney disease. Lancet 369: 1287–1301, 2007 - PubMed
    1. Gabow PA, Johnson AM, Kaehny WD, Kimberling WJ, Lezotte DC, Duley IT, Jones RH: Factors affecting the progression of renal disease in autosomal-dominant polycystic kidney disease. Kidney Int 41: 1311–1319, 1992 - PubMed
    1. Yoder BK: Role of primary cilia in the pathogenesis of polycystic kidney disease. J Am Soc Nephrol 5: 1381–1388, 2007 - PubMed
    1. Nauli SM, Alenghat FJ, Luo Y, Williams E, Vassilev P, Li X, Elia AE, Lu W, Brown EM, Quinn SJ, Ingber DE, Zhou J: Polycystins 1 and 2 mediate mechanosensation in the primary cilium of kidney cells. Nat Genet 33: 129–137, 2003 - PubMed
    1. Hanaoka K, Qian F, Boletta A, Bhunia AK, Piontek K, Tsiokas L, Sukhatme VP, Guggino WB, Germino GG: Co-assembly of polycystin-1 and -2 produces unique cation-permeable currents. Nature 408: 990–994, 2000 - PubMed

Publication types

Substances