. 2010 Mar;51(3):1699-708.
doi: 10.1167/iovs.09-3557. Epub 2009 Oct 15.

Increased synthesis of leukotrienes in the mouse model of diabetic retinopathy

Affiliations

Increased synthesis of leukotrienes in the mouse model of diabetic retinopathy

Ramaprasad Talahalli et al. Invest Ophthalmol Vis Sci. 2010 Mar.

Abstract

Purpose: Evidence suggests that capillary degeneration in early diabetic retinopathy results from chronic inflammation, and leukotrienes have been implicated in this process. The authors investigated the cellular sources of leukotriene biosynthesis in diabetic retinas and the effects of hyperglycemia on leukotriene production.

Methods: Retinas and bone marrow cells were collected from diabetic and nondiabetic mice. Mouse retinal glial cells and retinal endothelial cells (mRECs) were cultured under nondiabetic and diabetic conditions. Production of leukotriene metabolites was assessed by mass spectrometry, and Western blot analysis was used to quantitate the expression of enzymes and receptors involved in leukotriene synthesis and signaling.

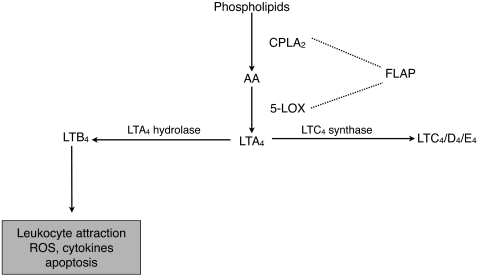
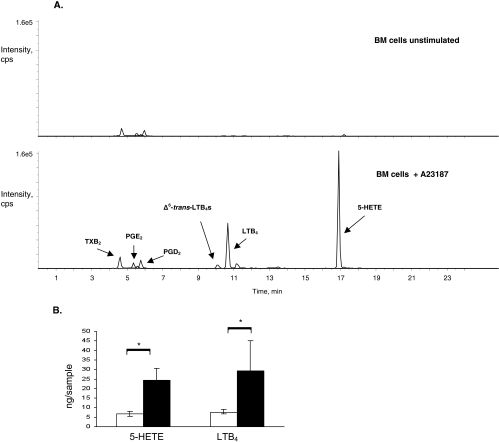
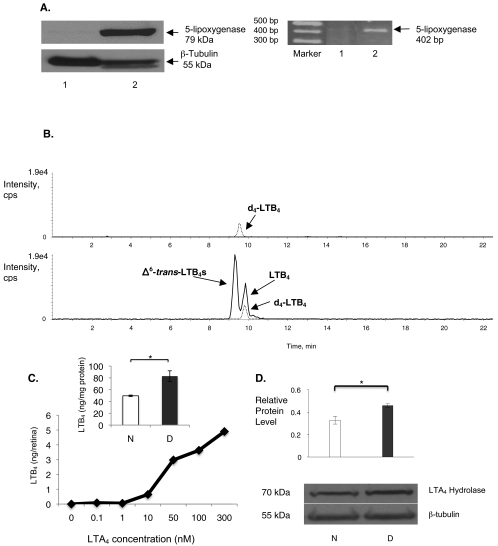
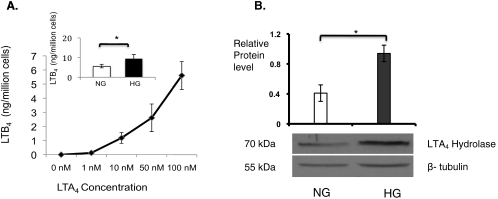
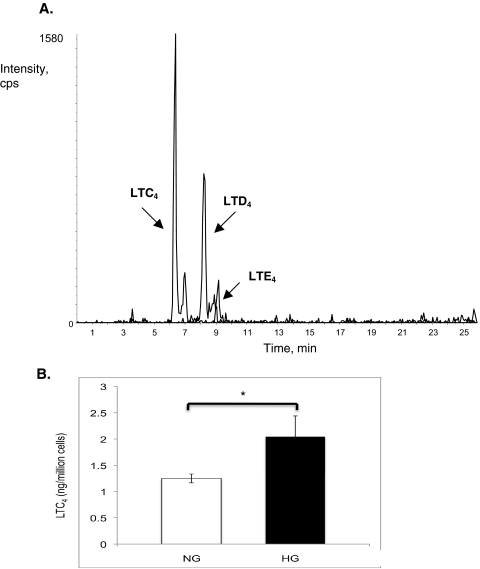
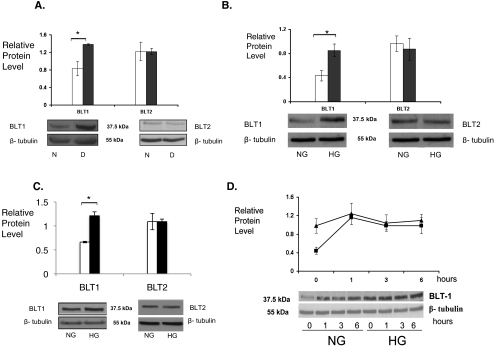
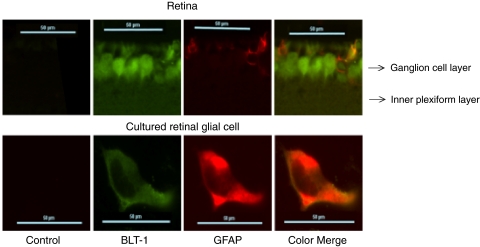
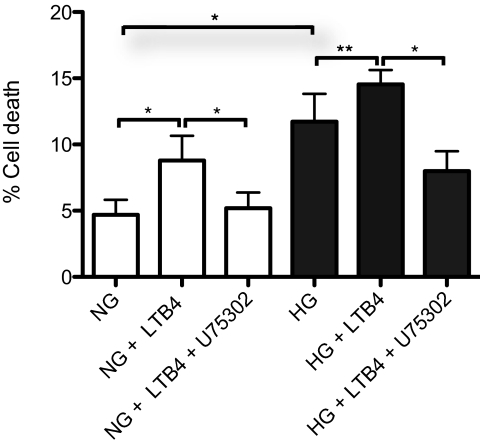
Results: Bone marrow cells from nondiabetic mice expressed 5-lipoxygenase, the enzyme required for the initiation of leukotriene synthesis, and produced leukotriene B(4) (LTB(4)) when stimulated with the calcium ionophore A23187. Notably, LTB(4) synthesis was increased threefold over normal (P < 0.03) in bone marrow cells from diabetic mice. In contrast, retinas from nondiabetic or diabetic mice produced neither leukotrienes nor 5-lipoxygenase mRNA. Despite an inability to initiate leukotriene biosynthesis, the addition of exogenous leukotriene A(4) (LTA(4); the precursor of LTB(4)) to retinas resulted in robust production of LTB(4). Similarly, retinal glial cells synthesized LTB(4) from LTA(4), whereas mRECs produced both LTB(4) and the cysteinyl leukotrienes. Culturing the retinal cells in high-glucose concentrations enhanced leukotriene synthesis and selectively increased expression of the LTB(4) receptor BLT1. Antagonism of the BLT1 receptor inhibited LTB(4)-induced mREC cell death.

Conclusions: Transcellular delivery of LTA(4) from marrow-derived cells to retinal cells results in the generation of LTB(4) and the death of endothelial cells and, thus, might contribute to chronic inflammation and retinopathy in diabetes.


Figures

Figure 1.
Figure 1.
Synthesis of leukotrienes.
Figure 2.
Figure 2.
Leukotriene synthesis by mouse bone marrow cells. (A) Mass spectrometric analysis of methanol extracts of unstimulated mouse bone marrow cells produced trace amounts of eicosanoid metabolites, prostaglandins more than leukotrienes (upper tracing). When stimulated with the calcium ionophore A23187, mouse bone marrow cells produced 5-HETE and LTB4 (lower tracing). Prostaglandins, including prostaglandin E2 (PGE2), prostaglandin D2 (PGD2), and thromboxane B2 (TXB2), were also detected. (B) When stimulated with calcium ionophore, bone marrow cells from diabetic mice (black bars) produced significantly more 5-HETE and LTB4 than bone marrow cells from nondiabetic mice (white bars). Bone marrow samples were analyzed from four mice per group. *P < 0.03 in each case comparing diabetic and nondiabetic mice.
Figure 3.
Figure 3.
Leukotriene synthesis by mouse retina. (A) Western blot analysis (left) and RT-PCR (right) analysis of mouse retina (lane 1) did not detect 5-lipoxygenase expression. As anticipated, 5-lipoxygenase was detected in mouse bone marrow cells (lane 2). Data are representative of the results in retinas isolated from six different mice. (B) Mass spectrometric analysis of methanol extracts of mouse retina did not detect leukotriene metabolites. Upper tracing: internal standard deuterated LTB4 ([d4]-LTB4). After the addition of LTA4 to the mouse retina, LTB4 was produced (lower tracing). Nonenzymatic generation of Δ6-trans-LTB4 was also detected. (C) Increasing the dose of exogenous LTA4 (0–300 nM) resulted in an increase in endogenous LTB4 production. The dose-response curve was generated using six retinas, with each retina receiving a different dose of LTA4. (C, inset) After the addition of 100 nM LTA4, LTB4 synthesis was increased in retinas from diabetic mice (D, black bar) compared with retinas from nondiabetic mice (N, white bar; n = 3 retinas per group; *P < 0.02). (D) By Western blot analysis, the expression of LTA4 hydrolase in retinas of diabetic mice (D, n = 6) was increased compared with that of nondiabetic mice (N, n = 6; *P < 0.001). The level of protein expression is depicted relative to the reference protein β-tubulin.
Figure 4.
Figure 4.
Leukotriene synthesis by mouse retinal glial cells. (A) Methanol extracts of mouse retinal glial cells were analyzed by mass spectrometry. Mouse retinal glial cells produced LTB4 in a dose-dependent manner after the addition of LTA4. (A, inset) After the addition of 100 nM LTA4, LTB4 synthesis was enhanced under conditions of high glucose (HG) compared with physiologic glucose (NG, n = 3; *P < 0.02). (B) Western blot analysis of retinal glial cell lysates demonstrated a high glucose (HG)-induced increase in expression of LTA4 hydrolase compared with the reference protein, β-tubulin, when compared with physiologic glucose (NG, n = 6; *P < 0.001).
Figure 5.
Figure 5.
Leukotriene synthesis by mouse retinal endothelial cells. (A) Methanol extracts from mouse retinal endothelial cells analyzed by mass spectrometry demonstrated production of the cysteinyl leukotrienes LTC4, LTD4, and LTE4. (B) After the addition of 100 nM LTA4, synthesis of LTC4 by mouse retinal endothelial cells was increased under high glucose (black bar) compared with physiologic glucose (white bar; n = 6; *P < 0.03).
Figure 6.
Figure 6.
High glucose increases BLT1 receptor expression. Western blot analysis of mouse retinas (A), mouse retinal glial cells (B), and mRECs (C) demonstrated a high glucose-induced increase in BLT1 expression, but not BLT2 expression (physiologic glucose: N or NG, white bars; high glucose: D or HG, black bars). For analysis of mouse retinas, six diabetic and six nondiabetic retinas were analyzed (BLT1; *P < 0.01). Experiments with cultured cells were conducted in triplicate. (BLT1; *P < 0.005 for mouse retinal glial cells and for mRECs). (D) Addition of LTB4 to retinal glial cells grown in physiologic glucose (NG) concentrations induced the expression of BLT1 (squares). Maximal expression of BLT1 under these conditions was similar to the increased expression of BLT1 seen under high-glucose (HG) conditions (triangles). The level of protein expression is depicted relative to the reference protein β-tubulin.
Figure 7.
Figure 7.
Colocalization of BLT1 and the glial cell marker GFAP. Sections of mouse retina were analyzed for BLT1 and GFAP expression using immunofluorescence. Top: ganglion cell layer and the inner plexiform layer of the retina are shown. Left to right: lack of immunofluorescence detected in control sections stained with only secondary antibodies. BLT1 expression (green), followed by GFAP expression (red), and finally the color overlay demonstrating colocalization of BLT1 and GFAP in retinal glial cells. Bottom: similar results for a cultured retinal glial cell. Sections are representative of the results from eight retinal sections from four mice, and the cultured cell is representative of four different experiments.
Figure 8.
Figure 8.
BLT1 mediates retinal microvascular endothelial cell death. When cultured under physiologic glucose conditions, the addition of 100 nM LTB4 to mRECs increased mREC death, as determined by trypan blue exclusion assay (*P < 0.005). Inclusion of the BLT1 antagonist U75302 completely inhibited the effect of LTB4 on cell death (*P < 0.005). When mRECs were cultured under high-glucose conditions, an increase in cell death was noted, and the addition of LTB4 further increased the observed cell death (HG vs. NG, *P < 0.005; HG vs. HG + LTB4, **P < 0.03). U75302 treatment significantly reduced mREC cell death in the presence of high glucose and LTB4 (*P < 0.005). Data are the summary of six independent experiments.

References

    1. Antonetti DA, Barber AJ, Khin S, Lieth E, Tarbell JM, Gardner TW. Vascular permeability in experimental diabetes is associated with reduced endothelial occludin content: vascular endothelial growth factor decreases occludin in retinal endothelial cells. Penn State Retina Research Group Diabetes 1998;47:1953–1959 - PubMed
    1. Antonetti DA, Lieth E, Barber AJ, Gardner TW. Molecular mechanisms of vascular permeability in diabetic retinopathy. Semin Ophthalmol 1999;14:240–248 - PubMed
    1. Du Y, Miller CM, Kern TS. Hyperglycemia increases mitochondrial superoxide in retina and retinal cells. Free Radical Biol Med 2003;35:1491–1499 - PubMed
    1. Gardner TW, Antonetti DA, Barber AJ, LaNoue KF, Nakamura M. New insights into the pathophysiology of diabetic retinopathy: potential cell-specific therapeutic targets. Diabetes Technol Ther 2000;2:601–608 - PubMed
    1. Joussen AM, Poulaki V, Le ML, et al. A central role for inflammation in the pathogenesis of diabetic retinopathy. FASEB J 2004;18:1450–1452 - PubMed

Publication types

MeSH terms