. 2009 Nov-Dec;15(6):1415-24.
doi: 10.1109/TVCG.2009.177.

Sampling and visualizing creases with scale-space particles

Affiliations

Sampling and visualizing creases with scale-space particles

Gordon L Kindlmann et al. IEEE Trans Vis Comput Graph. 2009 Nov-Dec.

Abstract

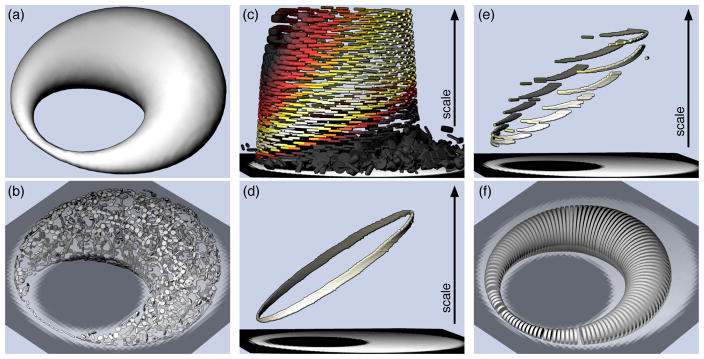
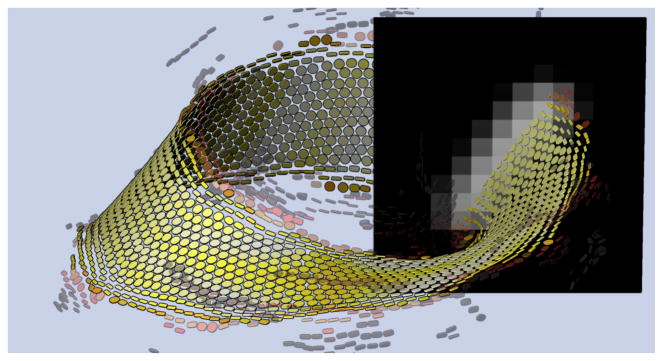
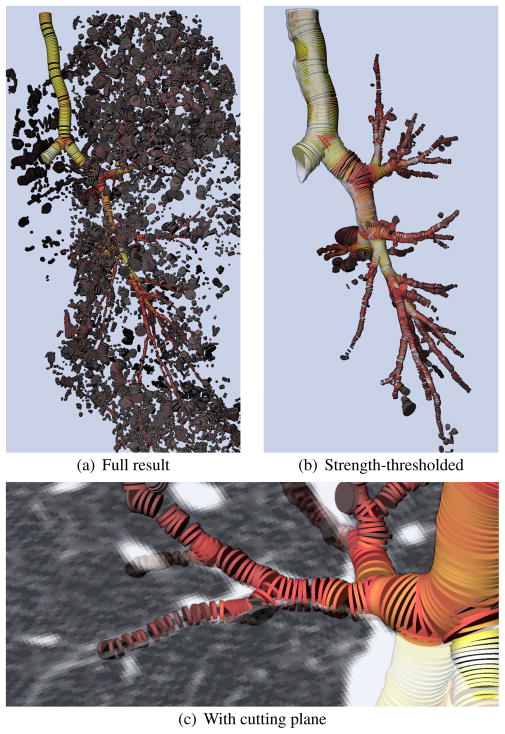
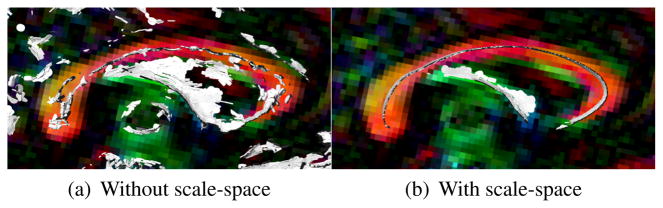
Particle systems have gained importance as a methodology for sampling implicit surfaces and segmented objects to improve mesh generation and shape analysis. We propose that particle systems have a significantly more general role in sampling structure from unsegmented data. We describe a particle system that computes samplings of crease features (i.e. ridges and valleys, as lines or surfaces) that effectively represent many anatomical structures in scanned medical data. Because structure naturally exists at a range of sizes relative to the image resolution, computer vision has developed the theory of scale-space, which considers an n-D image as an (n+1)-D stack of images at different blurring levels. Our scale-space particles move through continuous four-dimensional scale-space according to spatial constraints imposed by the crease features, a particle-image energy that draws particles towards scales of maximal feature strength, and an inter-particle energy that controls sampling density in space and scale. To make scale-space practical for large three-dimensional data, we present a spline-based interpolation across scale from a small number of pre-computed blurrings at optimally selected scales. The configuration of the particle system is visualized with tensor glyphs that display information about the local Hessian of the image, and the scale of the particle. We use scale-space particles to sample the complex three-dimensional branching structure of airways in lung CT, and the major white matter structures in brain DTI.


Figures

Fig. 1
Fig. 1
The shape of a synthetic volume is shown with an isosurface (a). Ridge lines sampled at the original scale (b), shown with a semi-transparent cutting plane, capture only the narrowest portion correctly. Scale-space particles sample the feature manifold through the 4-D scale-space of different blurring levels with spline interpolation across scales (c); the colormap highlights with white the spatially-varying scale of maximal ridge strength. Feature scale is accurately recovered in (d) with an energy term from ridge strength; this is not possible with linear (e) instead of spline interpolation across the same pre-blurred scale samples. Glyphs in (f) show scale with disc radius, indicating a successful sampling of the complete ridge line localized in both space and scale.
Fig. 2
Fig. 2
Comparison of error with linear and cubic Hermite scale-space interpolation for s ∈ [0,5], reconstructed with 6 samples, placed either uniformly or non-uniformly. Scale-space particles use Hermite interpolation with optimized non-uniform samples for greatly improved accuracy.
Fig. 3
Fig. 3
Inter-particle energy starts with radial profile φc(r) in (a) (with w = 0.6, d = −0.1 for illustrative purposes), used in scale-repelling Φ1(r, s) in (b). Butterworth function b(ω) (with bord = 20, bcut = 0.87) in (c) windows the scale-attractive Φ2(r, s) in (d), shown with β = 0.5.
Fig. 4
Fig. 4
Ridge surface sampling of a Möbius strip from a 40 × 40 × 20 scalar volume demonstrates the shapes of D1 tensor glyphs and the need for thresholding feature strength (colormapped on glyphs).
Fig. 5
Fig. 5
Valley line analysis of lung CT to find airways. The complete result (a) is cleaned up with strength thresholding and connected-component analysis (b). Cutting plane (c) shows underlying unsegmented data relative to sampled features.
Fig. 6
Fig. 6
Scale-repelling inter-particle energy Φ1 results in (a), colormapped by strength, provide context for evaluating two samplings (b) and (d) from different parameters for scale-attractive inter-particle energy Φ2. 3-D visualization in (c), colormapped by scale, puts results from settings in (b) above those in (d).
Fig. 7
Fig. 7
Whole-brain scale-space FA ridge surfaces, colormapped by scale (brighter colors for higher scales).
Fig. 8
Fig. 8
The corpus callosum is a particularly large-scale feature that benefits from scale-space sampling (b) and is not reliably captured by a ridge at a single scale (a).
Fig. 9
Fig. 9
FA ridge lines in scale-space (a) capture some white matter features known to be more tubular, such as the cingulum bundles (b).

References

    1. Arsigny V, Fillard P, Pennec X, Ayache N. Log-Euclidean metrics for fast and simple calculus on diffusion tensors. Magnetic Resonance in Medicine. 2006 August;56(2):411–421. - PubMed
    1. Aylward S, Bullitt E, Pizer S, Eberly D. Intensity ridge and widths for tubular object segmentation and description. Proc. Workshop on Mathematical Methods in Biomedical Image Analysis (MMBIA); 1996. pp. 131–138.
    1. Aylward SR, Bullitt E. Initialization, noise, singularities, and scale in height ridge traversal for tubular object centerline extraction. IEEE Trans on Medical Imaging. 2002 Feb;21(2):61–75. - PubMed
    1. Basser P, Mattiello J, LeBihan D. MR diffusion tensor spectroscopy and imaging. Biophysics Journal. 1994;66(1):259–267. - PMC - PubMed
    1. Basser PJ, Pajevic S, Pierpaoli C, Duda J, Aldroubi A. In vivo fiber tractograpy using DT-MRI data. Magnetic Resonance in Medicine. 2000;44:625–632. - PubMed

Publication types