. 2010 Mar;17(3):469-81.
doi: 10.1038/cdd.2009.148. Epub 2009 Oct 16.

Disruption of PPARgamma signaling results in mouse prostatic intraepithelial neoplasia involving active autophagy

Affiliations

Disruption of PPARgamma signaling results in mouse prostatic intraepithelial neoplasia involving active autophagy

M Jiang et al. Cell Death Differ. 2010 Mar.

Abstract

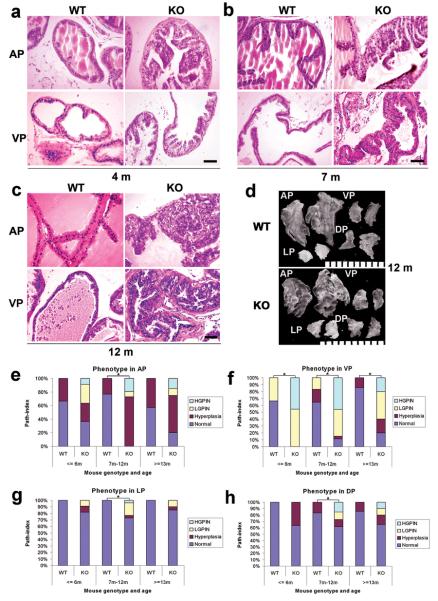
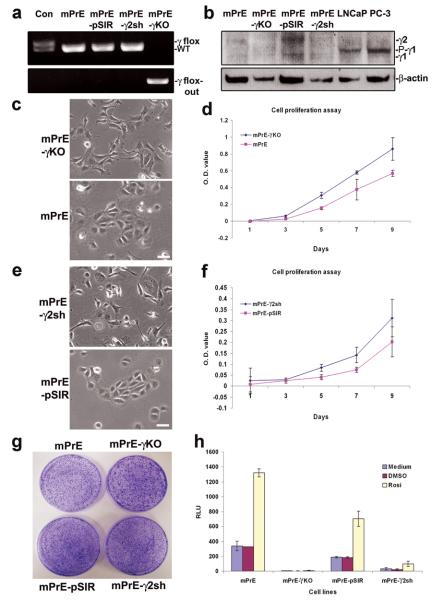
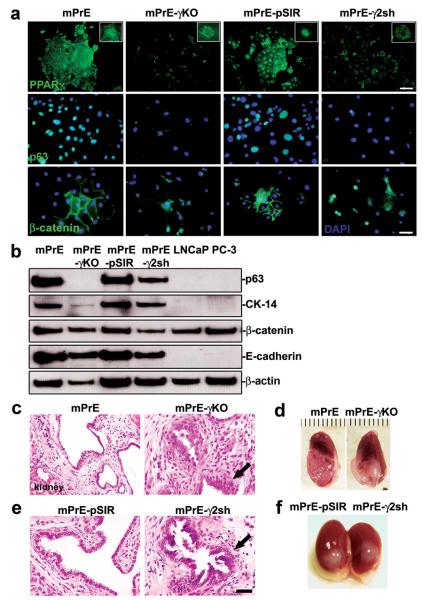
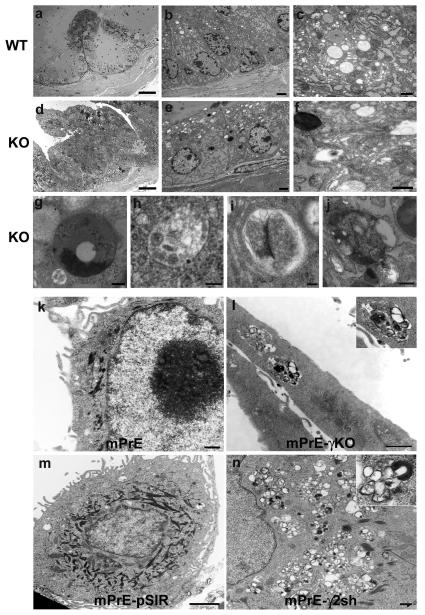
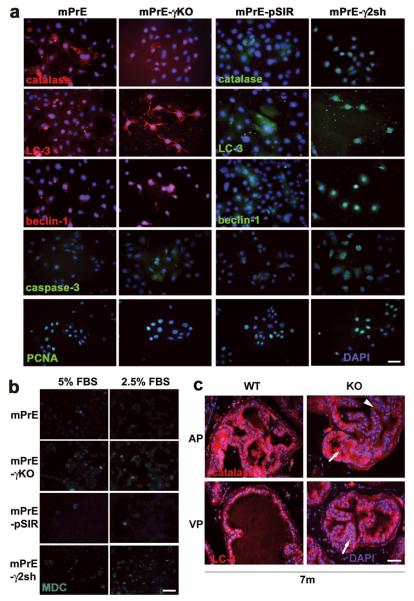
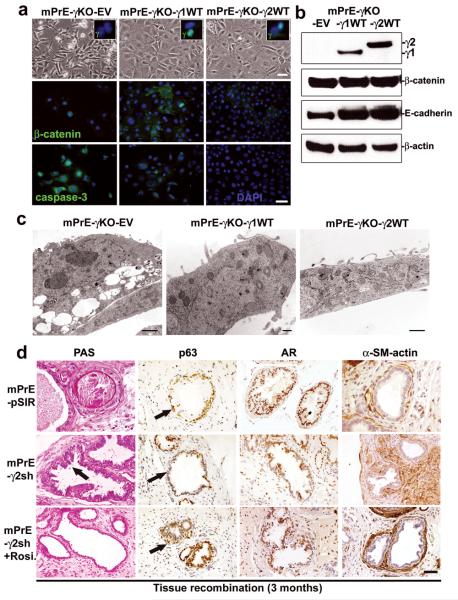
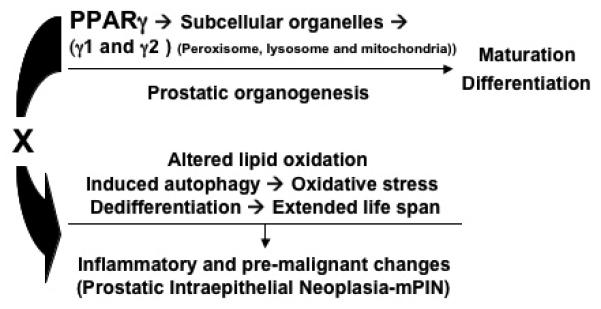
Peroxisome proliferator-activated receptor-gamma (PPARgamma) regulates the interface between cellular lipid metabolism, redox status and organelle differentiation. Conditional prostatic epithelial knockout of PPARgamma in mice resulted in focal hyperplasia which developed into mouse prostatic intraepithelial neoplasia (mPIN). The grade of PIN became more severe with time. Electron microscopy (EM) showed accumulated secondary lysosomes containing cellular organelles and debris suggestive of autophagy. Consistent with this analysis the autophagy marker LC-3 was found to be upregulated in areas of PIN in PPARgamma KO tissues. We selectively knocked down PPARgamma2 isoform in wild-type mouse prostatic epithelial cells and examined the consequences of this in a tissue recombination model. Histopathologically grafted tissues resembled the conditional PPARgamma KO mouse prostates. EM studies of PPARgamma- and PPARgamma2-deficient epithelial cells in vitro were suggestive of autophagy, consistent with the prostatic tissue analysis. This was confirmed by examining expression of beclin-1 and LC-3. Gene expression profiling in PPARgamma-/gamma2-deficient cells indicated a major dysregulation of cell cycle control and metabolic signaling networks related to peroxisomal and lysosomal maturation, lipid oxidation and degradation. The putative autophagic phenotypes of PPARgamma-deficient cells could be rescued by re-expression of either gamma1 or gamma2 isoform. We conclude that disruption of PPARgamma signaling results in autophagy and oxidative stress during mPIN pathogenesis.


Figures

Figure 1
Figure 1. Progressive mouse prostatic intraepithelial neoplasia (mPIN) in conditional PPARγ KO mouse prostates
(a, b and c) H&E stained sections illustrate the progressive development of mPIN from a low grade at the age of 3 months (a) to a high grade at the age of 7 months (b) and 12 months (c) in the AP and VP of PPARγ KO mice prostatic epithelium, compared to a paired WT control mouse. Scale bar = 100 μm in the panels. (d) Gross appearance of the four mouse prostate lobes, anterior (AP), ventral (VP), lateral (LP) and dorsal prostate (DP), dissected from 12 month old WT and conditional PPARγ KO mice, illustrating similar gross appearance. Scale bar = 1 mm between two small bars. (e, f, g and h) Summary of the incidence of high grade PIN (HGPIN), low grade PIN (LGPIN), Hyperplasia and Normal in the AP, VP, LP and DP of age matched groups of WT and PPARγ KO mouse groups at the ages of ≤ 6 months (3 WT, 11 KO), 7-12 months (48 WT, 26 KO) and ≥ 13 months (7 WT, 20 KO), Total 58 WT mice and 57 KO. *: P < 0.01 by Fisher's Exact Test.
Figure 2
Figure 2. Establishment and characterization of the stable mPrE-PPARγ knockout and mPrE-PPARγ2 knockdown cell lines
(a) Demonstration of genomic DNA for PPARγ alleles in control mouse tail (Con, PBCre4 0/0/PPARγ flox/WT), mPrE, mPrE-pSIR and mPrE-γ2sh cell lines and its deletion (upper panel) and concurrent presence of a PPARγ flox-out band (lower panel) in the mPrE-KO cell lines by PCR. (b) Western blot showing loss of PPARγ1 (−γ1) and PPARγ2 (−γ2) proteins expression in mPrE-γKO cells and reduced PPARγ2 expression in mPrE-γ2sh cells as compared to mPrE and mPrE-pSIR control cells. A Phosphorylated-PPARγ1 (P-γ1) band showed only in LNCaP and PC-3 cells. (c and d) The effect of loss of PPARγ on cellular morphology and proliferation. Phenotypically the control mPrE cells showed cobblestone morphology while mPrE-γKO cells exhibited a more extended spindle-like phenotype with loss of cell-cell contacts. Scale bar = 50 μm. Loss of PPARγ resulted in increased cellular proliferation as determined by MTT assay. (e and f) The cellular morphology and proliferation of mPrE-γ2sh and mPrE-pSIR cells in culture. Phenotypically these cells showed changes similar to those evoked by the knockout of PPARγ in the mPrE-γKO cells. Suppression of PPARγ2 protein expression resulted in increased cellular proliferation. (g) mPrE-γKO and mPrE-γ2sh cells form larger clones compared to control mPrE and mPrE-pSIR cells when tested using a clonogenicity assay. (h) PPRE activity detected by a luciferase reporter showed a >85% decrease in the mPrE-γ2sh cells as compared to mPrE controls. Signal was undetectable in mPrE-γKO cells. Rosiglitazone has no effect on PPRE activity of mPrE-γKO cells. However it shows mild activation on PPRE activity of mPrE-γ2sh cells, confirming that these cells retain a weakened ability to respond to this PPARγ agonist.
Figure 3
Figure 3. Consequences of PPARγ deletion and suppression in prostate epithelial cells
(a) PPARγ, p63 and β-catenin proteins detected by immunofluorescence in mPrE, mPrE-γKO, mPrE-pSIR and mPrE-γ2Sh cells. Note the loss of nuclear PPARγ staining in mPrE-γKO and mPrE-γ2sh cells as compared to the control cells confirming the efficiency of disruption of PPARγ protein expression (higher magnification in the inset). Loss of PPARγ is associated with a loss of cobblestone morphology, cell-cell contacts, and an associated decrease in nuclear localization of p63 protein and membranous localization of β-catenin as well as nuclear transfer of β-catenin. Scale bar (PPARγ) = 100 μm. Scale bar (p63 and β-catenin) = 50 μm. (b) Western blot analysis demonstrated that p63, CK-14, β-catenin and E-cadherin proteins decreased in mPrE-γKO and mPrE-γ2sh cells compared to mPrE and mPrE-pSIR controls. LNCaP and PC-3 cells were used as the controls. (c and e) Histology of tissue recombinants using rat urogenital sinus mesenchyme (UGM) with mPrE, mPrE-γKO, mPrE-pSIR and mPrE-γ2Sh cells examined at two months post-grafting. The control recombinants resembled prostatic glandular differentiation although with some flattening of epithelial layers consistent with previous descriptions. Tissue recombinants made using mPrE-γKO (c) and mPrE-γ2sh (e) cells grew less readily. Histopathologically these structures exhibited a phenotype consistent with mPIN with epithelial crowding and tufting and out-growths (arrow). Scale bar = 50 μm. (d and f) Gross appearance of tissue recombinants using mPrE and mPrE-pSIR cells were similar, showing glandular differentiation by two months post grafting. In contrast tissue recombinants made using mPrE-γKO (d) cells and mPrE-γ2sh (f) cells grew less readily and exhibited a less obviously glandular phenotype.
Figure 4
Figure 4. Increased autophagic features in the ultrastructure of PPARγ knockout prostate epithelium and mPrE-PPARγ2 shRNA cells
Light and electron microscopy of prostate tissue indicated significant morphological differences between WT (a-c) and PPARγ KO (d-f) mice at the age of 12 months. Toluidine blue staining of thick plastic sections (a and d) indicated increased cellularity and fewer secretory vesicles in the epithelium from PPARγ KO mice prostate. Scale bar (a and d) = 50 μm. Ultrastructurally, the WT mouse prostate epithelial cells showed a normal distribution of cytoplasmic constituents, organelles and secretory vesicles (b and c). In contrast, the PPARγ KO cells had abnormal appearing mitochondria and increased numbers of lysosomes. The lysosomes had varied morphology. Some exhibited a classical appearance (e and f) or appeared as multivesicular bodies (f) while others had the appearance of autophagosomes (g-j). Scale bars: (b) = 2 μm, (c) = 500 nm, (e) = 2 μm, (f) = 500 nm, (g) = 500 nm, (h) = 100 nm, (i) = 100 nm and (j) = 500 nm. Cytoplasmic organelles in mPrE and mPrE-pSIR cells had a normal distribution and ultrastructural appearance (k and m). In contrast mPrE-γKO cell demonstrated a decrease in mitochondria and increase in secondary lysosomes (l). Inset: increase magnification image lysosome containing numerous membranes and other debris, suggestive of autophagosome. mPrE-γ2sh cells had increased lysosomes, many having the appearance of autophagosomes (n). Inset: autophagosome. Scale bars (k) = 500 nm, (l) = 1 μm, (m) = 2 μm and (n) = 500 nm.
Figure 5
Figure 5. Alterations in autophagy-associated protein expression in mPrE-PPARγ knockout and mPrE-PPARγ2 shRNA cells
(a) Catalase, LC-3 (Atg8), beclin-1 (Atg6), caspase-3 and PCNA proteins were detected by immunofluorescence staining in mPrE and mPrE-γKO, mPrE-pSIR and mPrE-γ2sh cells grown on glass slides for three days. Decreased catalase and increased LC-3 and beclin-1 were seen in mPrE-γKO and mPrE-γ2sh cells compared to mPrE and mPrE-pSIR cells. These results suggested active autophagic body formation in the cells. Meanwhile, caspase-3 and PCNA were increased in PPARγ-/γ2-deficient cells. Scale bar = 50μm in the panels. (b) MDC, a marker of autophagy, was visualized in mPrE and mPrE-γKO, mPrE-pSIR and mPrE-γ2sh cells under the 5% FBS regular or 2.5% FBS half-starvation culture conditions. Elevated staining was seen in both mPrE-γKO and mPrE-γ2sh cells as compared to mPrE and mPrE-pSIR cells. The signals were strongly increased in PPARγ-/γ2-deficient cells in the 2.5% FBS culture media. Scale bar = 50 μm in the panels. (c) Immunofluorescence staining of catalase and LC-3 in wild-type (WT) and PPARγ knockout (KO) prostate tissue at ages of 7 months. Low levels of catalase expression and high expression of LC-3 protein were seen in the PIN regions (arrows) of PPARγ KO mouse prostate epithelium compared to WT and more normal-appearing areas (arrowhead). Scale bar = 50 μm in the panels.
Figure 6
Figure 6. Rescue of phenotypes of mouse PPARγ-deficient prostate epithelial cells by re-expression of either PPARγ1 or PPARγ2 isoform or treatment by Rosiglitazone
(a) Phase-contrast microscopy morphology of control mPrE-γKO-empty vector and mPrE-γKO-PPARγ1 or -PPARγ2 WT cDNA cells, showing a return to a cobblestone morphology following reintroduction of each PPARγ isoform. IF staining confirmed expression of PPARγ protein in the nuclei of mPrE-γKO-γ1WT and mPrE-γKO-γ2WT cells (inset boxes). β-catenin protein was predominantly nuclear in mPrE-γKO whereas in mPrE-γKO-γ1WT and mPrE-γKO-γ2WT cells the protein was found in the cytoplasm and on intercellular membrane interfaces. Caspase-3 was decreased in mPrE-γKO-γ1WT and mPrE-γKO-γ2WT cells compared to mPrE-γKO-EV cells. Scale bar = 50 μm. (b) Western blot analysis demonstrated PPARγ1 protein in mPrE-γKO-γ1WT and PPARγ2 in mPrE-γKO-γ2WT cells. β-catenin and E-cadherin protein levels increased in mPrE-γKO-γ1WT and mPrE-γKO-γ2WT cells compared to mPrE-γKO-EV control cells. (c) mPrE-γKO-EV cells had decreased mitochondria and increased lipid droplets and secondary lysosomes, similar to mPrE-γKO cells. Scale bar = 2 μm. However introduction of the mouse PPARγ1 wild-type cDNA increased mitochondria above wild-type values and decreased the presence of secondary lysosomes and lipid accumulation. Scale bar = 250 nm. Likewise, introduction of the mouse PPARγ2 wild-type cDNA into mPrE-γKO cells restored the level of mitochondria and reduced the instances of secondary lysosomes and lipid droplets. Scale bar = 500 nm. (d) Tissue recombinants made using control (mPrE-pSIR) or mPrE-γ2sh cells with rat UGM. Sections were examined for secretion by PAS. In control recombinants a normal prostatic phenotype with secretion was noted. In contrast in the mPrE-γ2sh containing recombinants a low grade mPIN (arrow) with less secretion into the luminal space and thickened stromal was seen. p63 and AR protein were decreased in the mPrE-γ2sh containing recombinants, but α-SM-actin protein expression was increased compared to tissue recombinants of mPrE-pSIR. Mice carrying tissue recombinants made by mPrE-pSIR and mPrE-γ2sh cells were administered Rosiglitazone chow (0.005% Rosiglitazone) from the time of grafting until sacrifice at three months. Tissue recombinants of mPrE-γ2sh in these mice (designated mPrE-γ2sh+Rosi.) showed secretion, and increased p63 protein in the basal layer and p63 negative-luminal differentiation by IHC staining (arrows). These recombinants showed well-differentiated prostatic glandular structure and a more normal-appearing stroma. Scale bar = 50 μm in the panels.
Figure 7
Figure 7. Disruption of PPARγ resulted in mouse prostate carcinogenesis involving oxidative stress and autophagy
The simplified diagram brings together data from the studies and presents a model illustrating how the PPARγ signaling contributes to prostate carcinogenesis from wild-type to mPIN formation and to set up conditions that would predispose cells to further malignant progression. These data suggested an important role for the PPARγ gene in maintaining the maturation, differentiation and turnover of subcellular organelles (peroxisomes, mitochondria and lysosomes) during mouse prostatic organogenesis and development. In particular this model suggests that a mechanism by which loss of PPARγ could lead to mouse PIN related to the disruption of cellular peroxisomal and mitochondrial lipid metabolism and oxidative stress (hypoxia) and active autophagy for the extended life span and cellular dedifferentiation.

Similar articles

Cited by

References

    1. Yu K, Bayona W, Kallen CB, Harding HP, Ravera CP, McMahon G, et al. Differential activation of peroxisome proliferator-activated receptors by eicosanoids. J Biol Chem. 1995 Oct 13;270(41):23975–23983. - PubMed
    1. Hihi AK, Michalik L, Wahli W. PPARs: transcriptional effectors of fatty acids and their derivatives. Cell Mol Life Sci. 2002 May;59(5):790–798. - PMC - PubMed
    1. Tontonoz P, Hu E, Graves RA, Budavari AI, Spiegelman BM. mPPAR gamma 2: tissue-specific regulator of an adipocyte enhancer. Genes & development. 1994 May 15;8(10):1224–1234. - PubMed
    1. Michalik L, Desvergne B, Dreyer C, Gavillet M, Laurini RN, Wahli W. PPAR expression and function during vertebrate development. The International journal of developmental biology. 2002 Jan;46(1):105–114. - PubMed
    1. Mao-Qiang M, Fowler AJ, Schmuth M, Lau P, Chang S, Brown BE, et al. Peroxisome-proliferator-activated receptor (PPAR)-gamma activation stimulates keratinocyte differentiation. J Invest Dermatol. 2004 Aug;123(2):305–312. - PubMed

Publication types

MeSH terms