

Modeling latently infected cell activation: viral and latent reservoir persistence, and viral blips in HIV-infected patients on potent therapy
- PMID: 19834532
- PMCID: PMC2752194
- DOI: 10.1371/journal.pcbi.1000533
Modeling latently infected cell activation: viral and latent reservoir persistence, and viral blips in HIV-infected patients on potent therapy
Abstract
Although potent combination therapy is usually able to suppress plasma viral loads in HIV-1 patients to below the detection limit of conventional clinical assays, a low level of viremia frequently can be detected in plasma by more sensitive assays. Additionally, many patients experience transient episodes of viremia above the detection limit, termed viral blips, even after being on highly suppressive therapy for many years. An obstacle to viral eradication is the persistence of a latent reservoir for HIV-1 in resting memory CD4(+) T cells. The mechanisms underlying low viral load persistence, slow decay of the latent reservoir, and intermittent viral blips are not fully characterized. The quantitative contributions of residual viral replication to viral and the latent reservoir persistence remain unclear. In this paper, we probe these issues by developing a mathematical model that considers latently infected cell activation in response to stochastic antigenic stimulation. We demonstrate that programmed expansion and contraction of latently infected cells upon immune activation can generate both low-level persistent viremia and intermittent viral blips. Also, a small fraction of activated T cells revert to latency, providing a potential to replenish the latent reservoir. By this means, occasional activation of latently infected cells can explain the variable decay characteristics of the latent reservoir observed in different clinical studies. Finally, we propose a phenomenological model that includes a logistic term representing homeostatic proliferation of latently infected cells. The model is simple but can robustly generate the multiphasic viral decline seen after initiation of therapy, as well as low-level persistent viremia and intermittent HIV-1 blips. Using these models, we provide a quantitative and integrated prospective into the long-term dynamics of HIV-1 and the latent reservoir in the setting of potent antiretroviral therapy.
Conflict of interest statement
The authors have declared that no competing interests exist.
Figures

 ,
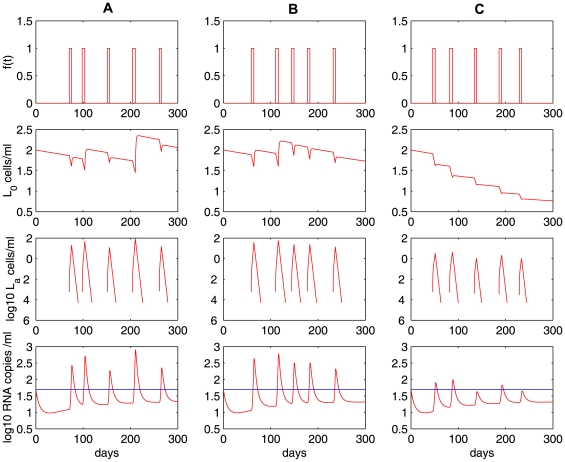
,  . Column A:
 . Activated latently infected cells divide about
  times over an interval , days. No statistically significant decay of the latent reservoir is observed. Column B:
 . The latent reservoir decays at a very slow rate. This realization shows a half-life of
  months. Column C:
 . Activated cells divide about
  times over the same time interval. The latent reservoir decays more quickly than it does in B, corresponding to a half-life of roughly
  months. The other parameter values used are listed in Table 1. The blue horizontal line represents the detection limit of 50 RNA copies/mL.
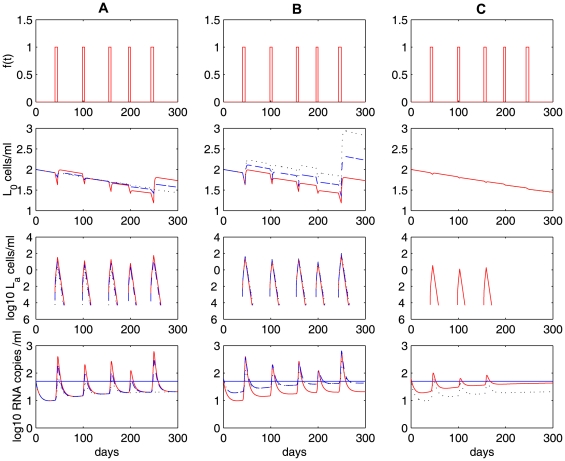
 , is fixed. Column A: the transition rate
  is fixed and the activation rate
  varies:
  (red solid),
  (blue dashed) and
  (black dotted).
  is fixed. Column B: the activation rate
  is fixed and the transition rate varies:
  (red solid),
  (blue dashed) and
  (black dotted).
  is fixed. Column C:
 and
and  are fixed. The viral production rate varies:
  (red solid) and
  (black dotted). The other parameter values used are the same as those in Figure 3. The blue horizontal line represents the detection limit of 50 RNA copies/mL.
 . Column A:
 ,
,  . No statistically significant decay of the latent reservoir is observed. Column B:
 ,
,  . The latent reservoir decays at a very slow rate. Column C:
 ,
,  . In this realization, there are 8 activations in 300 days. The latent reservoir decays more quickly than in Figure 3C. The other parameter values used are the same as those in Figure 3. The blue horizontal line represents the detection limit of 50 RNA copies/mL.
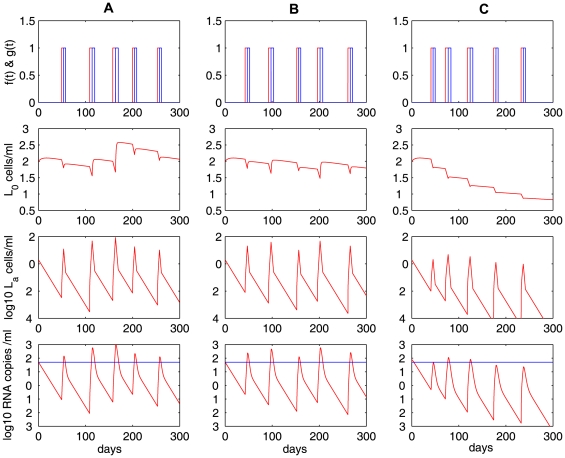
 is the expansion function (red) and
  is the rapid contraction function (blue). Different proliferation rates, i.e.,
  (Column A),
  (Column B), and
  (Column C), result in differential decay characteristics of the latent reservoir as in Figure 3. The other parameter values used are listed in Table 1. The blue horizontal line represents the detection limit of 50 RNA copies/mL.
 (red dashed line) and
  (blue solid line). Ongoing viral replication is only a minor contributor to the stability of the latent reservoir and low-level persistent viremia, as indicated by the minor effect of changing drug efficacy from
  to
to  . C and D: relative contributions of ongoing viral replication (
 was fixed) and latent cell activation to the latent reservoir and viral persistence. C: the ratio of
  to
to  , and D: the ratio of
  to
to  . We chose
  . The other parameter values used are listed in Table 1.
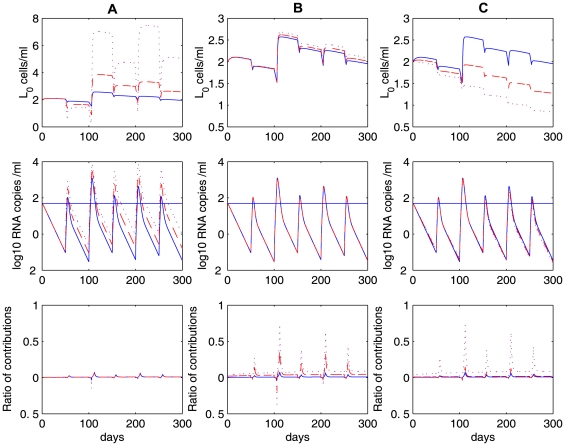
 to
to  . In column A, we use different activation rates:
  (blue solid),
  (red dashed), and
  (purple dotted). There is no change in the ratio of relative contributions. In column B, we use different fractions of new infections that result in latency:
  (blue solid),
  (red dashed), and
  (purple dotted). In column C, we use different reversion rates to latency:
  (blue solid),
  (red dashed), and
  (purple dotted). The other parameter values used are the same as those in Figure 7.
 drug is applied. A, D, G and J: the latent reservoir size; B, E, H and K: viral load; C, F, I and L: the ratio of
  to
to  , i.e., the relative contributions to the latent reservoir persistence from ongoing viral replication and latently infected cell proliferation. A, B and C: the carrying capacity of total latently infected cells is
  . We use different proliferation rates:
  (blue solid),
  (green dash-dotted), and
  (red dashed). The black solid line represents the detection limit. D, E and F:
  is fixed. Different carrying capacities of the total latently infected cells are used:
  (green dashed),
  (blue solid),
  (red dash-dotted). G, H and I: we use different fractions of infections that result in latency:
  (red dashed),
  (blue solid), and
  (black dotted). J, K and L: we use different drug efficacies:
  (red dashed),
  (blue solid),
  (black dotted).
  and the carrying capacity
  are fixed for the last two rows. The other parameter values used are listed in Table 1.
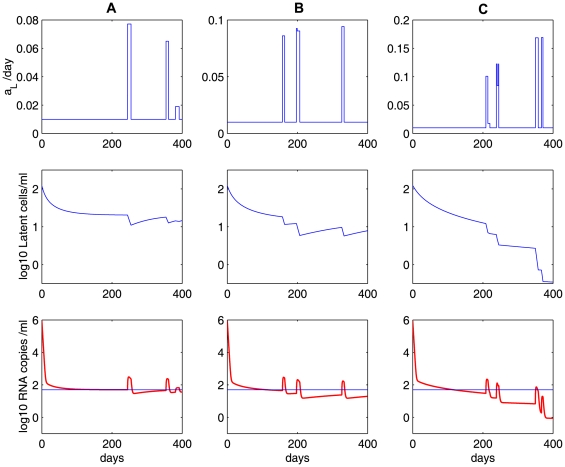
 . Column A:
 ; column B:
 ; column C:
 . Different values of
  represent different potentials of latently infected cells to renew themselves, and thus lead to different decay rates of the latent reservoir. The other parameter values used are listed in Table 1.
References
-
- Finzi D, Siliciano R. Viral dynamics in HIV-1 infection. Cell. 1998;93:665–671. - PubMed
-
- Simon V, Ho DD. HIV-1 dynamics in vivo: implications for therapy. Nat Rev Microbiol. 2003;1:181–190. - PubMed
-
- Perelson AS, Essunger P, Cao Y, Vesanen M, Hurley A, et al. Decay characteristics of HIV-1-infected compartments during combination therapy. Nature. 1997;387:188–191. - PubMed
-
- Gulick RM, Mellors JW, Havlir D, Eron JJ, Gonzalez C, et al. Treatment with indinavir, zidovudine, and lamivudine in adults with human immunodeficiency virus infection and prior antiretroviral therapy. N Engl J Med. 1997;337:734–739. - PubMed
Publication types
MeSH terms
Substances
Grants and funding
LinkOut - more resources
Full Text Sources
Other Literature Sources
Medical
Research Materials
