. 2009 Oct;5(10):e1000682.
doi: 10.1371/journal.pgen.1000682. Epub 2009 Oct 16.

Acetylation by the transcriptional coactivator Gcn5 plays a novel role in co-transcriptional spliceosome assembly

Affiliations

Acetylation by the transcriptional coactivator Gcn5 plays a novel role in co-transcriptional spliceosome assembly

Felizza Q Gunderson et al. PLoS Genet. 2009 Oct.

Abstract

In the last several years, a number of studies have shown that spliceosome assembly and splicing catalysis can occur co-transcriptionally. However, it has been unclear which specific transcription factors play key roles in coupling splicing to transcription and the mechanisms through which they act. Here we report the discovery that Gcn5, which encodes the histone acetyltransferase (HAT) activity of the SAGA complex, has genetic interactions with the genes encoding the heterodimeric U2 snRNP proteins Msl1 and Lea1. These interactions are dependent upon the HAT activity of Gcn5, suggesting a functional relationship between Gcn5 HAT activity and Msl1/Lea1 function. To understand the relationship between Gcn5 and Msl1/Lea1, we carried out an analysis of Gcn5's role in co-transcriptional recruitment of Msl1 and Lea1 to pre-mRNA and found that Gcn5 HAT activity is required for co-transcriptional recruitment of the U2 snRNP (and subsequent snRNP) components to the branchpoint, while it is not required for U1 recruitment. Although previous studies suggest that transcription elongation can alter co-transcriptional pre-mRNA splicing, we do not observe evidence of defective transcription elongation for these genes in the absence of Gcn5, while Gcn5-dependent histone acetylation is enriched in the promoter regions. Unexpectedly, we also observe Msl1 enrichment in the promoter region for wild-type cells and cells lacking Gcn5, indicating that Msl1 recruitment during active transcription can occur independently of its association at the branchpoint region. These results demonstrate a novel role for acetylation by SAGA in co-transcriptional recruitment of the U2 snRNP and recognition of the intron branchpoint.


Conflict of interest statement

The authors have declared that no competing interests exist.

Figures

Figure 1
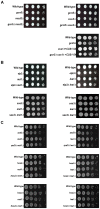
Figure 1. GCN5 interacts with genes encoding the non-essential U2 snRNP proteins, MSL1 and LEA1.
(A) Dilution series of double mutants, gcn5Δ msl1Δ and gcn5Δ lea1Δ. Cells were grown at 30°C in YPD liquid medium until the desired O.D.600 was obtained. Cells were spotted onto YPD plates as a ten-fold serial dilution, and the plates were incubated at 30°C for two days. (B) Viability analysis of the double mutants gcn5Δ msl1Δ and gcn5Δ lea1Δ in the presence of Gcn5 mutants. Cells were transformed with GCN5 HAT mutants (TRP plasmids, pRS314) and then streaked onto 5-FOA-TRP to select for the ability to lose the wild-type copy of GCN5 on a URA3-marked plasmid. Plates were incubated at 30°C for two days. Δ indicates deletion of GCN5; ΔΔ indicates deletion of GCN5 and either MSL1 or LEA1.
Figure 2
Figure 2. GCN5 genetic interactions with MSL1 and LEA1 are specific.
(A) Dilution series of double mutants gcn5Δ mud2Δ, gcn5Δ cus2Δ and gcn5Δcus1Δ+CUS1−54. Cells were grown at 30°C in YPD liquid medium until the desired O.D.600 was obtained. Cells were spotted onto YPD plates as a ten-fold serial dilution. Plates were incubated at 30°C for two days. (B) Dilution series of the double mutants elp3Δ msl1Δ, elp3Δ lea1Δ, sas3Δ msl1Δ, sas3Δ lea1Δ. Cells were treated as described in (A). (C) Dilution series of the double mutants rpd3D msl1D, rpd3D lea1D, hos2D msl1D, hos2D lea1D hos3D msl1D, and hos3D lea1D. Cells were treated as described in (A).
Figure 3
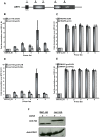
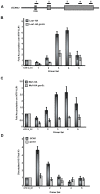
Figure 3. Deletion of GCN5 affects co-transcriptional recruitment of Lea1 to DBP2.
(A) Schematic of the intron-containing gene, DBP2. Underlined numbers represent amplicons generated from each primer set used in the study. (B) Graph depicting the occupancy of Lea1 at each region of DBP2 relative to the non-transcribed region, in wild-type or gcn5Δ. Dark grey bars represent Lea1 with wild-type GCN5 and light grey bars represent Lea1 levels in the gcn5Δ strain. (C) Bar graph depicting RNA pol II occupancy within DBP2 relative to the non-transcribed control. Dark grey bars represent RNAP II occupancy in the LEA1-HA strain and light grey bars represent RNAP II occupancy in the LEA1-HA gcn5Δ strain. (D) Graph depicting the occupancy of Lea1 with the Gcn5 HAT mutants, LKN and KQL. Dark grey bars represent Lea1 with the Gcn5 LKN mutation, light grey bars represent Lea1 with the Gcn5 KQL mutation. (E) Bar graph depicting RNA pol II occupancy in the presence of the Gcn5 HAT mutants. Dark grey bars represent RNA pol II occupancy with the Gcn5 LKN mutation and light grey bars represent RNAP II with the Gcn5 KQL mutant. All graphs depict the average of at least three independent experiments, and error bars represent the standard deviation. (F) Protein Immunoblot of strains used for ChIP assays. Wild-type and gcn5Δ cultures were grown in YPD liquid medium and whole cell extracts were prepared (see Material and Methods) and probed with anti-HA 12CA5 (Roche), shown in the top panel. Extracts were also probed with anti-PGK1 (Invitrogen/Molecular Probes) as a loading control (bottom panel).
Figure 4
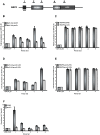
Figure 4. Deletion of GCN5 affects co-transcriptional recruitment of Msl1 to DBP2.
(A) Schematic of the intron-containing gene, DBP2. Underlined numbers represent the amplicons generated from each primer set used in the study. (B) Graph depicting Msl1 occupancy within each region of DBP2 relative to the non-transcribed region, with wild-type or gcn5Δ. Dark grey bars represent Msl1 occupancy in the presence of wild-type GCN5 and light grey bars represent Msl1 occupancy in the gcn5Δ strain. (C) Bar graph depicting RNAP II occupancy within DBP2. Dark grey bars represent RNA pol II occupancy in the MSL1-HA strain and light grey bars represent RNAP II occupancy in the MSL1-HA gcn5Δ. (D) Graph depicting the Msl1 occupancy in the presence of the Gcn5 HAT mutants, LKN and KQL. Dark grey bars represent the levels of Msl1 with the Gcn5 LKN mutation, light grey bars represent Msl1 with the Gcn5 mutant KQL. (E) Bar graph depicting the occupancy of RNA pol II within DBP2 in the presence of the Gcn5 HAT mutants. Dark grey bars represent RNAP II with the Gcn5 LKN mutation and light grey bars represent RNAP II with the Gcn5 KQL mutant. (F) ChIP analysis of histone H3 K9/14 acetylation within DBP2 in wild-type and gcn5Δ strains using an antibody directed against diacetylated histone H3 (Upstate). Dark grey bars represent wild-type and light grey bars represent histone acetylation in a gcn5Δ strain. Data are represented as diacetylated histone H3 normalized to the total amount of histone H3 (Total H3). All graphs depict the average of at least three independent experiments, and error bars represent the standard deviation.
Figure 5
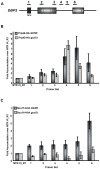
Figure 5. Co-transcriptional recruitment of U1 snRNP and U5 snRNP in the presence and absence of GCN5.
(A) Schematic of the intron-containing gene, DBP2. Underlined numbers represent the amplicons generated from each primer set used in the study. (B) Bar graph depicting recruitment of U1 snRNP (Prp42-HA) in the presence and absence of GCN5. Dark grey bars represent the occupancy of Prp42-HA in the presence of wild-type GCN5 and light grey bars represent Prp42-HA in the absence of GCN5. Occupancy is measured as fold accumulation over the non-transcribed region. (C) Bar graph depicting the recruitment of U5 snRNP (Snu114-HA) in the presence and absence of GCN5. Dark grey bars represent the Snu114-HA in the presence of GCN5, and light grey bars represent Snu114-HA occupancy in the absence of GCN5. Graphs represent the average of at least three independent experiments, and error bars represent the standard deviation.
Figure 6
Figure 6. Deletion of GCN5 affects co-transcriptional recruitment of Msl1 and Lea1 to ECM33 and histone H3 acetylation.
(A) Schematic of the intron-containing gene, ECM33. Underlined numbers represent the amplicons generated from each primer set used in the study. (B) Graph depicting the occupancy of Lea1 at each region of ECM33 relative to the non-transcribed region, in wild-type or gcn5Δcells. Dark grey bars represent Lea1 with wild-type GCN5, and light grey bars represent Lea1 levels in the gcn5Δ strain. (C) Bar graph depicting Msl1-HA occupancy within ECM33 relative to the non-transcribed control. Dark grey bars represent Msl-HA with wild-type GCN5 and light grey bars represent Msl1-HA occupancy in the gcn5Δ strain. Data are represented as fold accumulation over the non-transcribed region. (D) ChIP analysis of histone H3 K9/14 acetylation in ECM33 of wild-type and gcn5Δ strains using an antibody against diacetylated histone H3. Dark grey bars represent wild-type and light grey bars represent histone acetylation in a gcn5Δ strain. Data are represented as diacetylated histone H3 normalized to the total amount of histone H3 (Total H3). Graphs depict the average of three independent experiments, and error bars represent the standard deviation.

References

    1. Maniatis T, Reed R. An extensive network of coupling among gene expression machines. Nature. 2002;416:499–506. - PubMed
    1. Beyer AL, Osheim YN. Splice site selection, rate of splicing, and alternative splicing on nascent transcripts. Genes Dev. 1998;2:754–65. - PubMed
    1. Beyer AL, Osheim YN. Visualization of RNA transcription and processing. Semin Cell Biol. 1991;2:131–40. - PubMed
    1. Bauren G, Wieslander L. Splicing of Balbiani ring 1 gene pre-mRNA occurs simultaneously with transcription. Cell. 1994;76:183–92. - PubMed
    1. Huang S, Spector DL. Intron-dependent recruitment of pre-mRNA splicing factors to sites of transcription. J Cell Biol. 1996;133:719–32. - PMC - PubMed

Publication types

MeSH terms