. 2009 Oct;5(10):e1000623.
doi: 10.1371/journal.ppat.1000623. Epub 2009 Oct 16.

Induction of membrane ceramides: a novel strategy to interfere with T lymphocyte cytoskeletal reorganisation in viral immunosuppression

Affiliations

Induction of membrane ceramides: a novel strategy to interfere with T lymphocyte cytoskeletal reorganisation in viral immunosuppression

Evelyn Gassert et al. PLoS Pathog. 2009 Oct.

Abstract

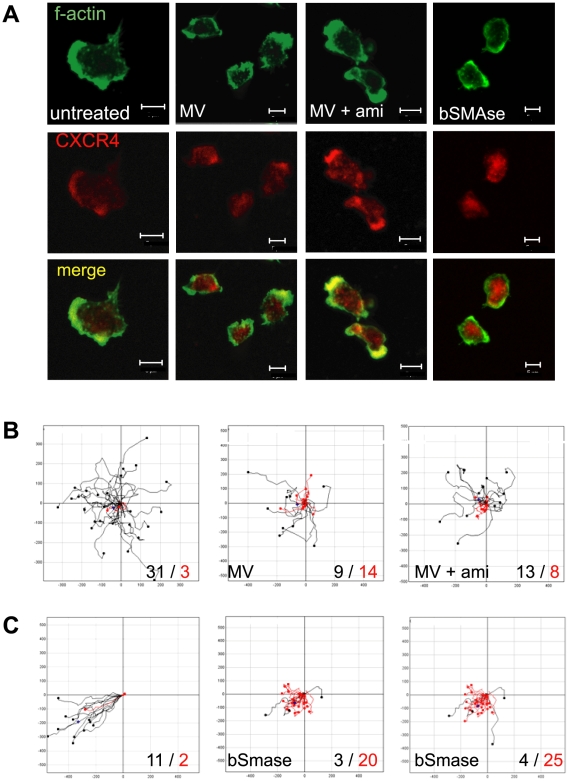
Silencing of T cell activation and function is a highly efficient strategy of immunosuppression induced by pathogens. By promoting formation of membrane microdomains essential for clustering of receptors and signalling platforms in the plasma membrane, ceramides accumulating as a result of membrane sphingomyelin breakdown are not only essential for assembly of signalling complexes and pathogen entry, but also act as signalling modulators, e. g. by regulating relay of phosphatidyl-inositol-3-kinase (PI3K) signalling. Their role in T lymphocyte functions has not been addressed as yet. We now show that measles virus (MV), which interacts with the surface of T cells and thereby efficiently interferes with stimulated dynamic reorganisation of their actin cytoskeleton, causes ceramide accumulation in human T cells in a neutral (NSM) and acid (ASM) sphingomyelinase-dependent manner. Ceramides induced by MV, but also bacterial sphingomyelinase, efficiently interfered with formation of membrane protrusions and T cell spreading and front/rear polarisation in response to beta1 integrin ligation or alphaCD3/CD28 activation, and this was rescued upon pharmacological or genetic ablation of ASM/NSM activity. Moreover, membrane ceramide accumulation downmodulated chemokine-induced T cell motility on fibronectin. Altogether, these findings highlight an as yet unrecognised concept of pathogens able to cause membrane ceramide accumulation to target essential processes in T cell activation and function by preventing stimulated actin cytoskeletal dynamics.


Conflict of interest statement

The authors have declared that no competing interests exist.

Figures

Figure 1
Figure 1. MV causes SMase activation and membrane ceramide accumulation in human T cells.
(A–D) Extracellular oriented ceramide accumulation was detected on Jurkat T cells exposed to MV (black symbols) or a MOCK preparation (white symbols) after the time intervals indicated. (A) By spot assay. Levels indicated were normalised to those measured on untreated cells; one out of three independent experiments is shown (inset: MV: upper, MOCK bottom row). (B–D) By surface detection. (B,C) FACScan on cells exposed to (B) MOCK (solid black curve) or MV (filled histogram) (exemplified for a 10 min exposure) (the grey line indicates staining of the isotype control antibody) or (C) MOCK, MGV (black triangles) or MV for the time intervals indicated (min), (D) by immunofluorescent staining (exemplified for a 10 min exposure to MOCK (a and blow up in c) or MV (b and blow up in d) (bars represent 25 (a, b) or 5 µm (c, d)). (E) Surface display of ASM was determined on Jurkat T cells exposed to MOCK (white symbols) or MV (black symbols) for the time intervals indicated by spot assay (inset; MV upper, MOCK bottom row (as in (A), values were normalised to those measured on untreated cells)). (F) ASM (open symbols) and NSM (closed symbols) activation by MV was measured by conversion of 14C-sphingomyelin to 14C-phosphorylcholine by extracts prepared from MV or MOCK-treated cells within 1 hr. Values shown indicate production of 14C-phosphorylcholine by MV over time, each expressed in relation to the respective MOCK control; levels of NSM activation significantly exceeding the background (t-test, p = 0.01) are indicated by an asterisk (data were generated in three independent experiments, standard deviations are indicated). (G) ASM surface display on primary human T cells in response to MOCK (white symbols) or MV (black symbols) over time measured by spot assay (inset; MV middle, MOCK bottom row). CD28-activation was used as a positive control (inset, upper row). (H) Left panel: Primary human T cells were left untreated (grey curve) or pre-exposed to amitriptyline (filled histogram) or GW4869 (black curve) for 2 hrs prior to MV exposure for the time intervals indicated, stained for ceramide surface display and analysed by FACScan. Right panel: Primary T cells were transfected using a scrambled (filled histogram) or a NSM2-specific siRNA (black and white line) prior to exposure to MOCK (white line) or MV (filled histogram and black line).
Figure 2
Figure 2. MV-induced SMase activation does not account for MV interference with stimulated T cell expansion.
(A) Human primary T cells left untreated or treated with amitriptyline (ami), fumonisin B (Fum B1), myriocin (myr) for 2 hrs were exposed to MV or MOCK in the presence of FIP and αCD3/CD28 stimulated. Proliferation was monitored by 3H-thymidine incorporation during the last 16 hrs of culture. One representative out of three independent experiments (each performed in triplicates) using three different donors is shown. (B) Spleen cells isolated from AsmKO or wild-type mice were exposed to MOCK or MV and αCD3/CD28 stimulated. Proliferation rates were determined as described in A, with those seen for the MOCK controls set to 100%. (C) Human primary T cells were either left untreated, or transfected with a scrambled (control siRNA) or a NSM2-specific siRNA (NSM2) or pretreated with the NSM-inhibitor (GW4869). 24 hrs after inhibitor treatment or 96 hrs after transfection, cells were exposed to MV (black bars) or MOCK (white bar), αCD3/CD28-stimulated and proliferation rates were determined as described in (A). Values obtained (in three independent experiments) for MOCK were each set to 100% and those obtained MV exposed samples (black bottom line) were determined as relative to the individual MOCK controls. The efficiency of NSM2 silencing by control or the specific siRNA was controlled by RT-PCR and WB (inset).
Figure 3
Figure 3. SMase activation accounts for MV-induced prevention of T cell polarisation and loss of membrane protrusions.
(A) Human T cells were transfected with a NSM2-specific or a scrambled siRNA for 96 hrs or exposed to amitriptyline (ami) or GW4869 2 hrs prior to MOCK (right panel, white bars) or MV (right panel, black bars) exposure for 2 hrs at 4°C and subsequently seeded onto FN-coated slides. Cells were fixed after 30 min and stained for f-actin and CD43 (exemplified in the left panel, with the scale bar representing 5 µm) and the percentage of cells revealing a front-rear polarisation with CD43 enriched in the uropod was determined. At least 100 cells per culture were recruited into the analysis. (B) Human T cell cultures exposed to MOCK or MV (pre-exposed to amitriptyline for 24 hrs or not) were seeded onto FN coated slides and analysed by SEM (left panel; bars represent 5 µm). Right panel: Cells in each culture were scored into morphological categories (non-, partially or fully polarized; see insets for examples; 100 cells per culture were counted) and the respective percentage of cells exposed to MV (black bars) or MOCK (white bars) was determined. (C) Left panel: Spleen cells from wild-type (upper and second row) or AsmKO mice (middle to bottom row) were exposed to MOCK (upper and third row), MV (second and fourth row) or C16 ceramide (bottom row) prior to seeding onto FN and subsequent SEM analysis. Right, upper panel: Wild-type or AsmKO spleen cells exposed to MV (black bars) or MOCK (white bars) were seeded onto FN and the percentages of cells forming membrane protrusions in each culture were determined by SEM. Right, bottom panel: AsmKO cells exposed to MOCK (white bars) or C16 ceramide (black bars) were seeded onto FN and percentages of cells revealing membrane protrusions or with smoot appearance were determined. Both right panels: At least 100 cells were recruited into the analysis per culture. Levels of significance were determined using a t-test (p = 0.01).
Figure 4
Figure 4. Ceramide generation abolishes T cell polarisation and spreading as well as pERM levels.
Human T cells (left untreated or exposed to bSMase, C16 or dC16 were seeded onto (A) FN (left and middle panel; right panel shows Jurkat cells 30 min after FN seeding) or (C) αCD3/CD28 coated slides, and stained, in (A), for f-actin alone or in (C), together with pERM protein. F-actin aggregates consistent with formation of podosome-like structures are exemplified by arrows. The percentages of cells acquiring a polarised phenotype in (A) (middle and right panel) or in (C), differing in morphology by developing organised round or incomplete lamellopodia or revealing pERM clusters and podosome-like structures (arrows) are indicated (at least each 100 cells were counted per culture). Scale bars represent 5 µm. (B) Levels of p-ezrin/moesin were determined in primary human T cells left untreated or exposed to bSMase at the concentrations indicated (left panel) or exposed to dC16 or C16 (50 µm) (right panel), each for 2 hrs by WB. p-ezrin or p-moesin levels were quantified by densitometry (bottom graphs). Detection of moesin served as loading control.
Figure 5
Figure 5. Ceramide accumulation abolishes redistribution of CXCR4 and affects T cell chemotactic motility.
(A) T cells left untreated (first column) or exposed to MV (second column) alone or after a 2 h pretreatment with amitriptilyne (third column) or to bSMase (fourth column) were seeded onto FN and stained for f-actin and CXCR4. Size bars represent 5 µm. (B and C) T cells were left untreated (each: left panel) or pretreated with amitriptyline ((B), right panel) or not before exposure to MV for 2 h at 4°C ((B), middle panel) or treated with bSMase ((C), middle and right panels) for 2 hrs at 37°C and seeded onto FN with addition of SDF-1 (1,5 µg/ml). Migration of cells on FN in response to SDF-1 was recorded over a time period of 10 min and the individual velocities of cells and their trajectories were calculated using ImageJ software. Tracks of cells faster than an arbitrary velocity threshold of 7 µm/min in B, or 9 µm/min in C, are indicated in black, those slower in red in each panel. Examples shown are representative of three individual experiments including different donors with a total of at least 120 cells recorded for each experimental setup.

Similar articles

Cited by

References

    1. Bollinger CR, Teichgraber V, Gulbins E. Ceramide-enriched membrane domains. Biochim Biophys Acta. 2005;1746:284–294. - PubMed
    1. Grassme H, Jekle A, Riehle A, Schwarz H, Berger J, et al. CD95 signalling via ceramide-rich membrane rafts. J Biol Chem. 2001;276:20589–20596. - PubMed
    1. Church LD, Hessler G, Goodall JE, Rider DA, Workman CJ, et al. TNFR1-induced sphingomyelinase activation modulates TCR signalling by impairing store-operated Ca2+ influx. J Leukoc Biol. 2005;78:266–278. - PubMed
    1. Gulbins E, Grassme H. Ceramide and cell death receptor clustering. Biochim Biophys Acta. 2002;1585:139–145. - PubMed
    1. Abdel Shakor AB, Kwiatkowska K, Sobota A. Cell surface ceramide generation precedes and controls FcgammaRII clustering and phosphorylation in rafts. J Biol Chem. 2004;279:36778–36787. - PubMed

Publication types

MeSH terms