. 2009 Oct;5(10):e1000691.
doi: 10.1371/journal.pgen.1000691. Epub 2009 Oct 16.

Targeted induction of endoplasmic reticulum stress induces cartilage pathology

Affiliations

Targeted induction of endoplasmic reticulum stress induces cartilage pathology

M Helen Rajpar et al. PLoS Genet. 2009 Oct.

Abstract

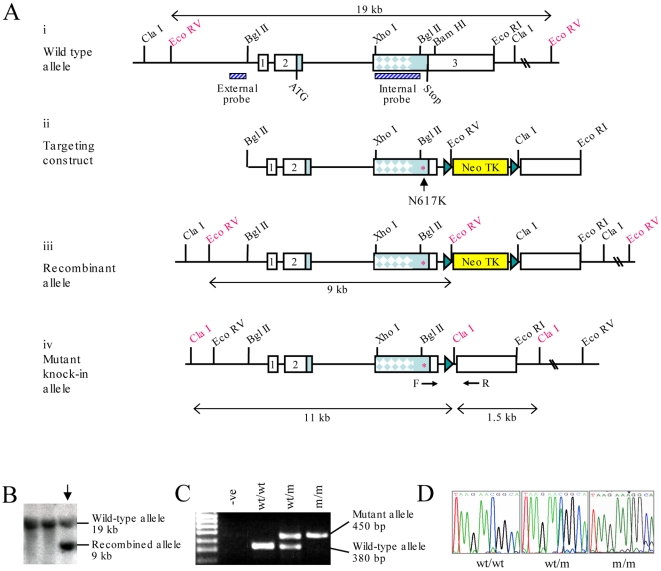
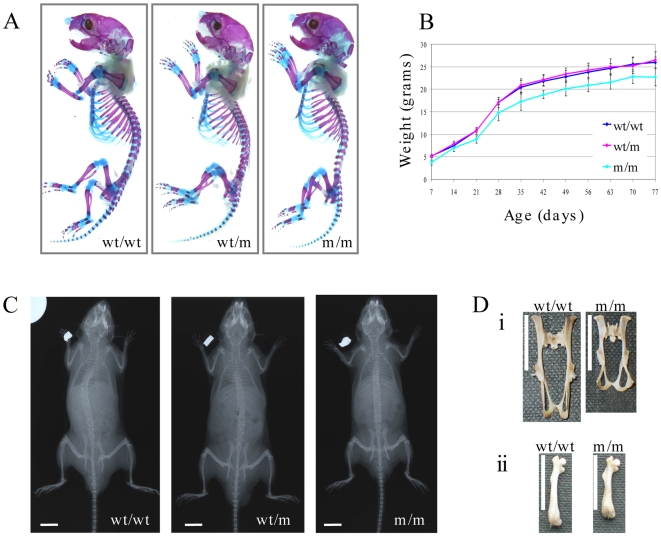
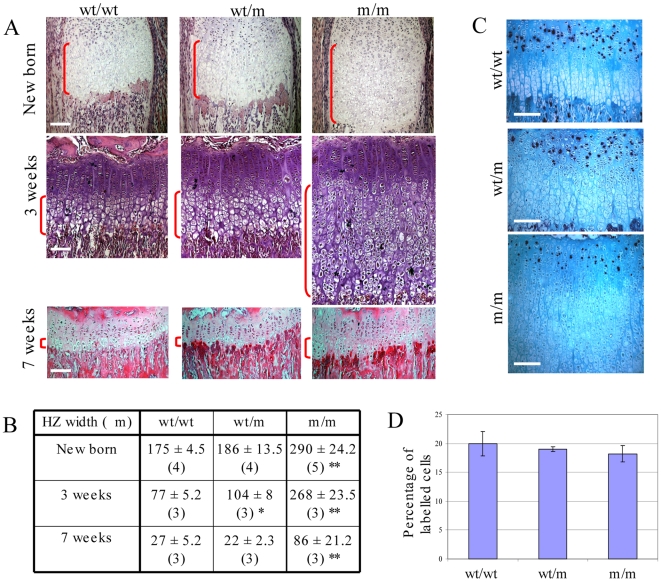
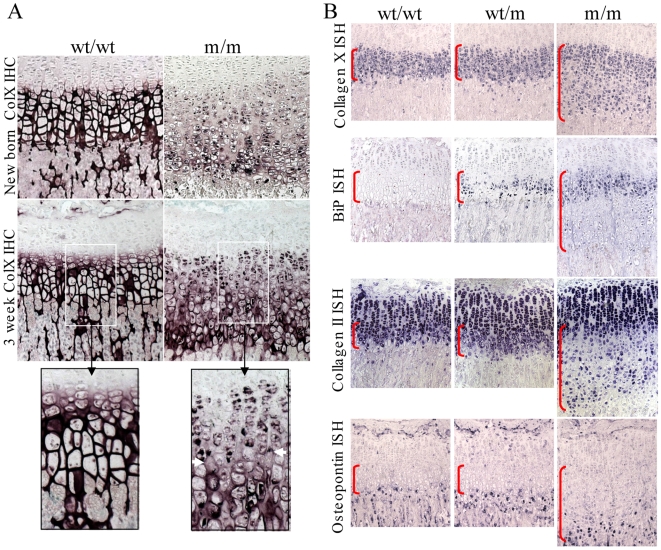
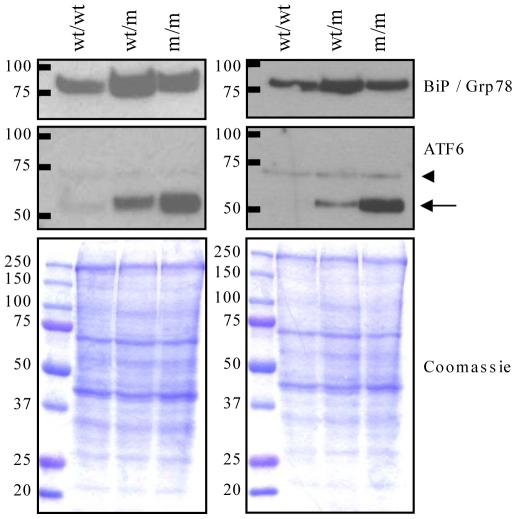
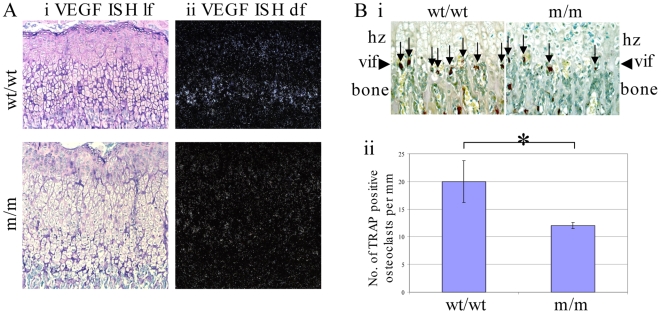
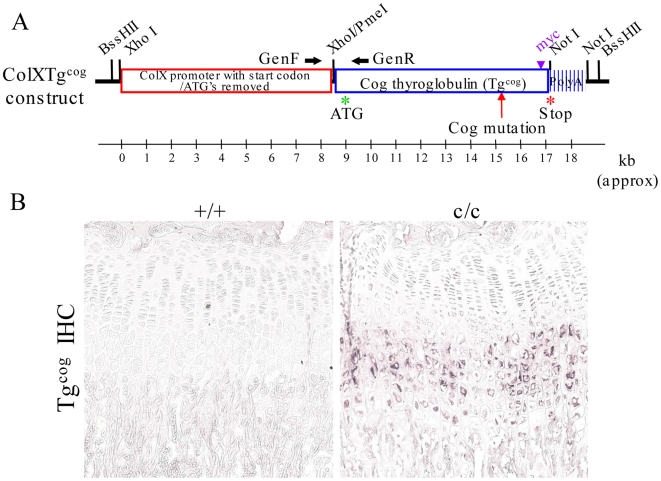
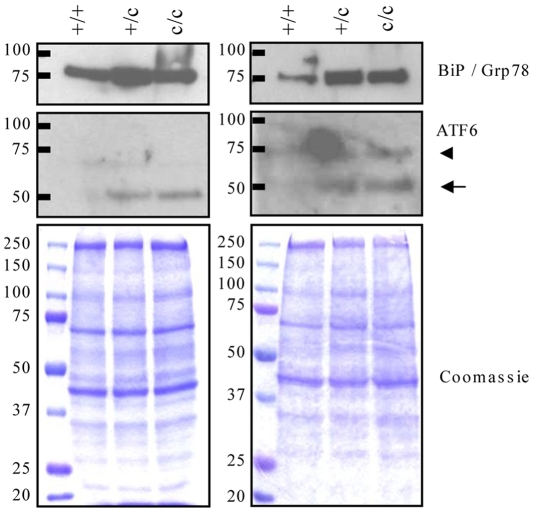
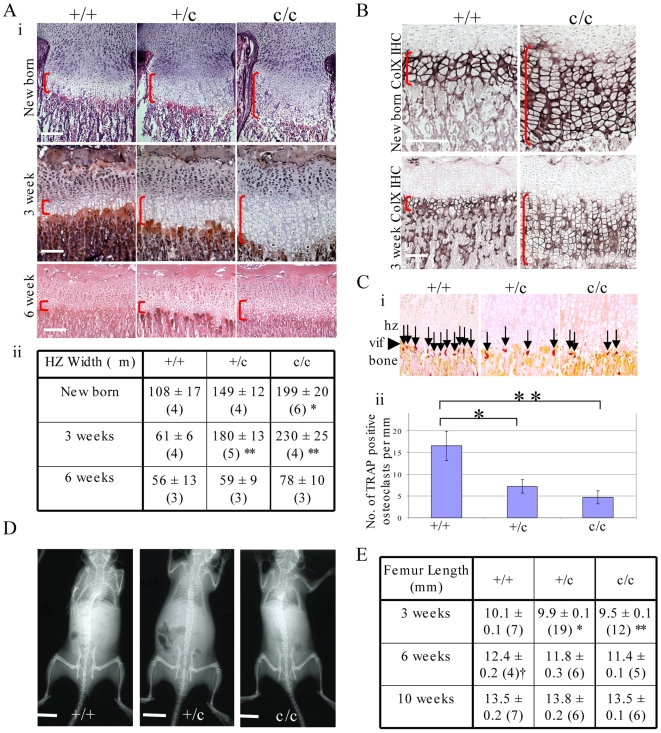
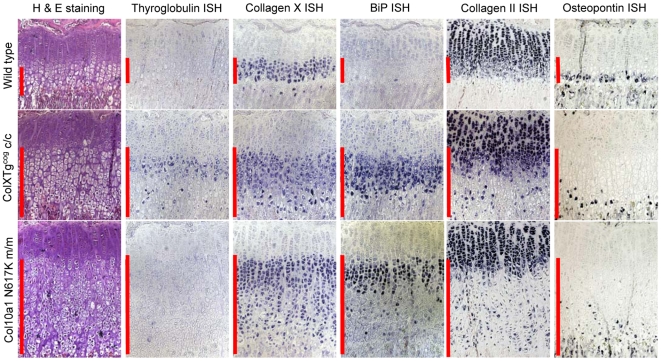
Pathologies caused by mutations in extracellular matrix proteins are generally considered to result from the synthesis of extracellular matrices that are defective. Mutations in type X collagen cause metaphyseal chondrodysplasia type Schmid (MCDS), a disorder characterised by dwarfism and an expanded growth plate hypertrophic zone. We generated a knock-in mouse model of an MCDS-causing mutation (COL10A1 p.Asn617Lys) to investigate pathogenic mechanisms linking genotype and phenotype. Mice expressing the collagen X mutation had shortened limbs and an expanded hypertrophic zone. Chondrocytes in the hypertrophic zone exhibited endoplasmic reticulum (ER) stress and a robust unfolded protein response (UPR) due to intracellular retention of mutant protein. Hypertrophic chondrocyte differentiation and osteoclast recruitment were significantly reduced indicating that the hypertrophic zone was expanded due to a decreased rate of VEGF-mediated vascular invasion of the growth plate. To test directly the role of ER stress and UPR in generating the MCDS phenotype, we produced transgenic mouse lines that used the collagen X promoter to drive expression of an ER stress-inducing protein (the cog mutant of thyroglobulin) in hypertrophic chondrocytes. The hypertrophic chondrocytes in this mouse exhibited ER stress with a characteristic UPR response. In addition, the hypertrophic zone was expanded, gene expression patterns were disrupted, osteoclast recruitment to the vascular invasion front was reduced, and long bone growth decreased. Our data demonstrate that triggering ER stress per se in hypertrophic chondrocytes is sufficient to induce the essential features of the cartilage pathology associated with MCDS and confirm that ER stress is a central pathogenic factor in the disease mechanism. These findings support the contention that ER stress may play a direct role in the pathogenesis of many connective tissue disorders associated with the expression of mutant extracellular matrix proteins.


Conflict of interest statement

The authors have declared that no competing interests exist.

Figures

Figure 1
Figure 1. Generation of the Col10a1 p.Asn617Lys MCDS mouse model.
(A) Targeting strategy: (i) Wildtype collagen X allele indicating location of probes used for Southern blotting and relevant restriction enzyme sites; exons are numbered boxes and the region of exon 3 encoding the collagenous domain is indicated by dappling; (ii) Targeting construct with p.Asn617Lys (N617K) mutation (*) and floxed Neo TK selection cassette; (iii) Recombinant allele identified using the external probe; (iv) Mutant knock-in allele containing the p.Asn617Lys mutation and residual LoxP site following deletion of the Neo TK cassette by transient Cre transfection and FIAU selection. (B) Positive clones were selected by screening EcoRV digested DNA with the external probe. Southern blot analysis was used to identify homologously recombined clones (↓) containing both the wildtype allele (19 kb) and the recombinant allele (9 kb). (C) Genotyping was performed by PCR amplification across the residual LoxP site using F and R primers shown in (A). (D) Chromatograph of the sequence flanking the mutation site from F2 mice, showing the C>A single base pair substitution in the heterozygote (wt/m), represented by a double peak, and the single A peak in the mouse homozygous for the mutation (m/m).
Figure 2
Figure 2. Macroscopic analyses of the MCDS mouse phenotype.
(A) Skeletal preps of new born mice stained with alizarin red (bone) and alcian blue (cartilage). (B) Growth curves of mice (females) heterozygous (wt/m) and homozygous (m/m) for collagen X p.Asn617Lys mutation, compared to wild-type (wt/wt) litter mates. (C) X-ray images of male mice at 11 weeks of age, scale bar = 1 cm. (D) Comparison of bone lengths between wt/wt and m/m mice: (i) pelvis; (ii) femur, vertical white scale bar = 1 cm.
Figure 3
Figure 3. Analysis of hypertrophic zone width.
(A) H & E staining of tibial growth plates from new born, 3 week and 7 week old MCDS and control mice. The hypertrophic zone is indicated by the vertical red brackets; horizontal white scale bar = 100 µm. (B) Hypertrophic zone widths at specified time points. *p<0.05, **p<0.01 versus control (wt/wt). (C) 5-bromo-2′-deoxyuridine (BrdU) labelling of proliferative cells in the growth plate of 3 week old mice. Positive cells stained black. (D) Graph showing the percentage of BrdU positive cells within the proliferative zone. The number of labelled cells in 4 different sections from 5 wt/wt, 5 wt/m and 4 m/m animals were counted.
Figure 4
Figure 4. Histological characterisation of 3-week-old tibial growth plates.
(A) Collagen X immunohistochemistry for MCDS and control mice. Purple staining indicates collagen X localisation; The black boxed photomicrographs represent an expanded view of the indicated areas in the sections from 3 week old mice. The intracellular accumulation of collagen X in the m/m growth plates is apparent in the upper hypertrophic zone. The transition region in which intracellular accumulation of collagen X resolves accompanied by a limited secretion of mutant collagen X is indicated by the white horizontal arrows in the expanded view of the 3 week m/m sample. (B) In situ hybridisation for Col10a1, BiP, Col2a1 (collagen II) and Opn (osteopontin) in tibial growth plate sections from 3 week old animals. The presence of the transcript is indicated by blue staining. The hypertrophic zone is indicated by the vertical red brackets.
Figure 5
Figure 5. Western blot analysis of MCDS mouse growth plate extracts.
The panels represent two independent analyses of growth plate extracts from wildtype (wt/wt), heterozygote (wt/m) and mice homozygous (m/m) for the Col10a1 p.Asn617Lys mutation. For each analysis, growth plates from the ribs of two 21 day old mice were pooled and extracted in sample buffer as described in the methods. Twenty micrograms of each extract was resolved on SDS-PAGE gels under reducing conditions, and western blotted for BiP and ATF6. Coomassie blue stained gels are protein loading controls. For the ATF6 blot, the cleaved form (50 kDa indicated by arrow) was readily detected in wt/m and m/m mouse extracts whereas the full-length ATF6 (90 kDa) was not detected in any samples. A non-specific band at about 70 kDa (arrow head) was apparent.
Figure 6
Figure 6. VEGF expression and osteoclast recruitment at the vascular invasion front.
(A) VEGF in situ hybridisation by 35S-labelled riboprobe and autoradiography: (i) light-field and (ii) dark field view of the same regions of the growth plate sections. (B) TRAP staining for osteoclasts at the vascular invasion front (vif - arrow heads, hz = hypertrophic zone); (i) Vertical arrows indicate positively stained cells (red/brown colour); (ii) Histogram depicting number of positive cells per 1 mm of vascular invasion front. *p<0.01 (n = 3 for each genotype).
Figure 7
Figure 7. Generation of the ColXTgcog mouse.
(A) Schematic of the ColXTgcog construct. The collagen X promoter as ligated upstream of the cDNA sequence encoding the myc-tagged cog mutant form of thyroglobulin (Tgcog). The cloning vector was removed and the construct injected into mouse embryo pronuclei; (B) Immunohistochemical localisation of Tgcog using a myc antibody on tibial growth plate section from a 3 week old control (+/+) and a transgenic ColXTgcog littermate (c/c). Expression of Tgcog is limited to the hypertrophic zone of the transgenic (c/c) mouse.
Figure 8
Figure 8. Western blot analysis of ColXTgcog mouse growth plate extracts.
The panels represent two independent analyses of growth plate extracts from wildtype (+/+), hemizygous (+/c) and mice homozygous (c/c) for ColXTgcog transgene. For each analysis, growth plates from the ribs of two 21 day old mice were pooled and extracted in sample buffer as described in the methods. Twenty micrograms of each extract was resolved on SDS-PAGE gels under reducing conditions, and western blotted for BiP and ATF6. Coomassie blue stained gels are protein loading controls. For the ATF6 blot, the cleaved form (50 kDa indicated by arrow) was readily detected in +/c and c/c mouse extracts whereas the full-length ATF6 (90 kDa) was not detected in any samples. A non-specific band at about 70 kDa (arrow head) was apparent.
Figure 9
Figure 9. Characterisation of the ColXTgcog mouse phenotype.
(A) Characterisation of the tibial hypertrophic zone expansion in new born, 3 week and 6 week old mice: (i) H & E staining at the different time points (vertical red brackets indicates the extent of the hypertrophic zone, horizontal white scale bar = 100 µm); (ii) Measurement of hypertrophic zone widths in the different genotypes (mean±SEM (n), *p<0.05 for c/c vs +/+, **p<0.001 for pooled c/c and +/c vs +/+. (B) Collagen X immunohistochemistry in new born and 3 week old mice (vertical red brackets indicates the extent of the hypertrophic zone, horizontal white scale bar = 100 µm). (C) TRAP staining for osteoclasts at the vascular invasion front (vif - arrow heads, hz = hypertrophic zone): (i) Vertical arrows indicate positively stained cells (red/brown colour); (ii) Histogram depicting number of positive cells per 1 mm of vascular invasion front. *p<0.05, **p<0.01 (n = 3 for each genotype). (D) X-ray images of 6 week old mice, scale bar = 1 cm. (E) Femoral length measurements (mean±SEM (n): *p<0.05 vs c/c; **p<0.01 vs +/+; p<0.05 vs pooled c/+ and c/c).
Figure 10
Figure 10. In situ hybridisation comparing the ColXTgcog and MCDS phenotype.
Tibial growth plates from 3 week old mice homozygous for either the ColXTgcog or Col10a1 p.Asn617Lys mutations were analysed for the expression of mRNAs encoding thyroglobulin, collagen X, BiP, collagen II, and osteopontin as indicated. The vertical red bars delineate the hypertrophic zones.

Similar articles

Cited by

References

    1. Aszódi A, Bateman JF, Gustafsson E, Boot-Handford R, Fässler R. Mammalian skeletogenesis and extracellular matrix: What can we learn from knockout mice? Cell Structure and Function. 2000;25:71–82. - PubMed
    1. Zuschik MJ, Hilton MJ, Zhang X, Chen D, O'Keefe RJ. Regulation of chondrogenesis and chondrocyte differentiation by stress. J Clin Invest. 2008;118:429–438. - PMC - PubMed
    1. Chan D, Jacenko O. Phenotypic and biochemical consequences of collagen X mutations in mice and humans. Matrix Biol. 1998;17:169–184. - PubMed
    1. Bateman JF, Wilson R, Freddi S, Lamande S, Savarirayan R. Mutations of COL10A1 in Schmid Metaphyseal Chondrodysplasia. Hum Mutation. 2005;25:525–534. - PubMed
    1. Kronenberg HM. Developmental regulation of the growth plate. Nature. 2003;423:332–336. - PubMed

Publication types

Substances