. 2009 Oct 16;4(10):e7475.
doi: 10.1371/journal.pone.0007475.

Identification of markers that distinguish monocyte-derived fibrocytes from monocytes, macrophages, and fibroblasts

Affiliations

Identification of markers that distinguish monocyte-derived fibrocytes from monocytes, macrophages, and fibroblasts

Darrell Pilling et al. PLoS One. .

Abstract

Background: The processes that drive fibrotic diseases are complex and include an influx of peripheral blood monocytes that can differentiate into fibroblast-like cells called fibrocytes. Monocytes can also differentiate into other cell types, such as tissue macrophages. The ability to discriminate between monocytes, macrophages, fibrocytes, and fibroblasts in fibrotic lesions could be beneficial in identifying therapies that target either stromal fibroblasts or fibrocytes.

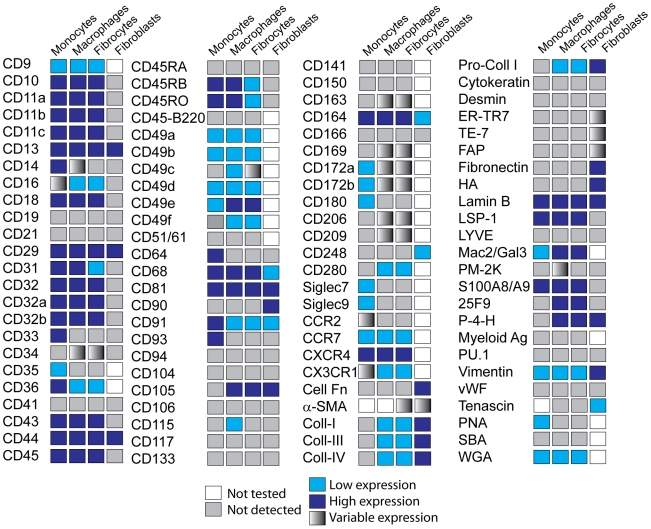
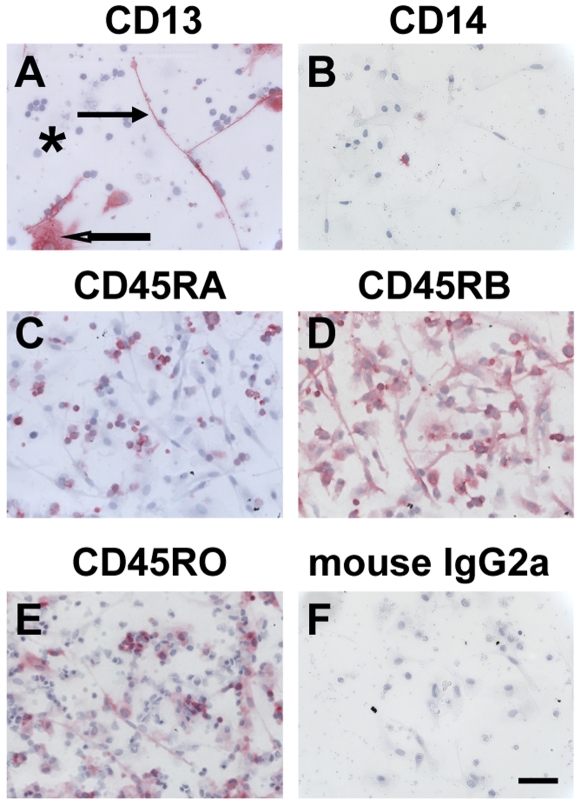
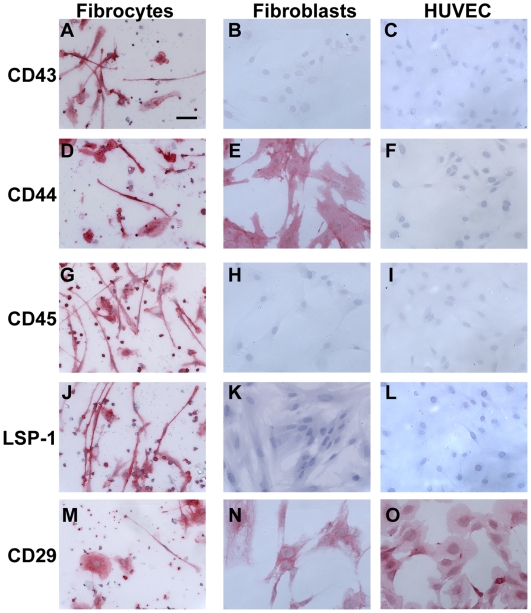
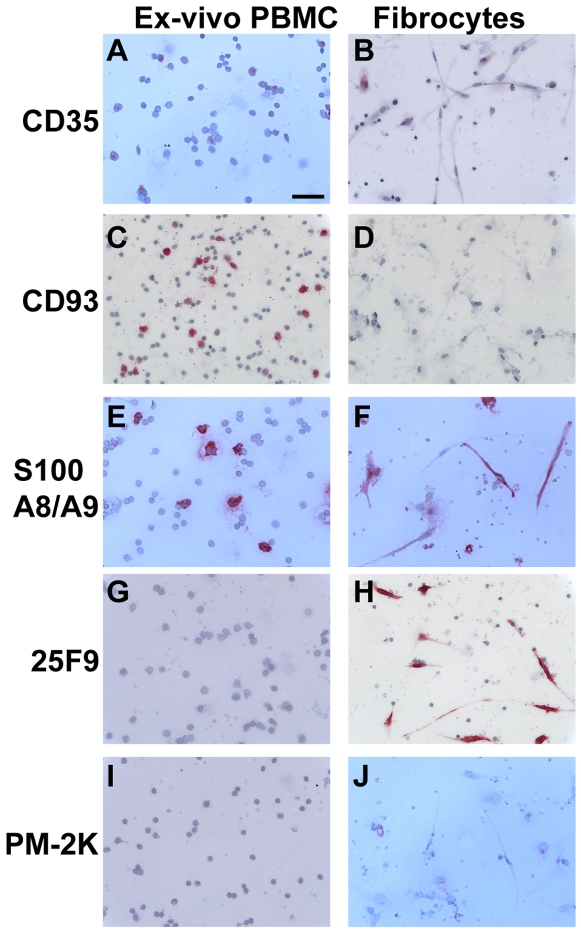
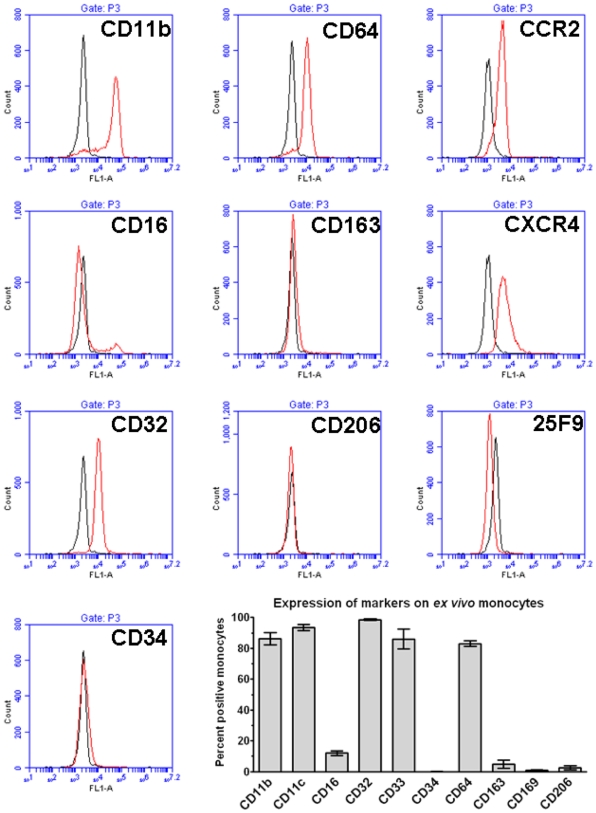
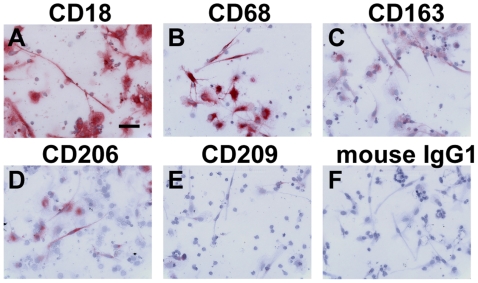
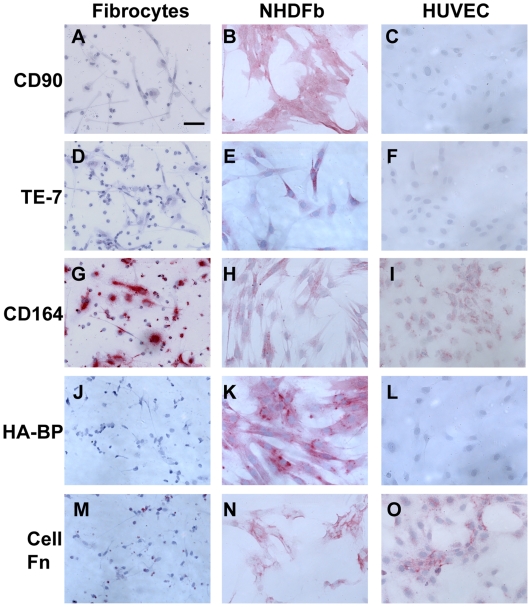
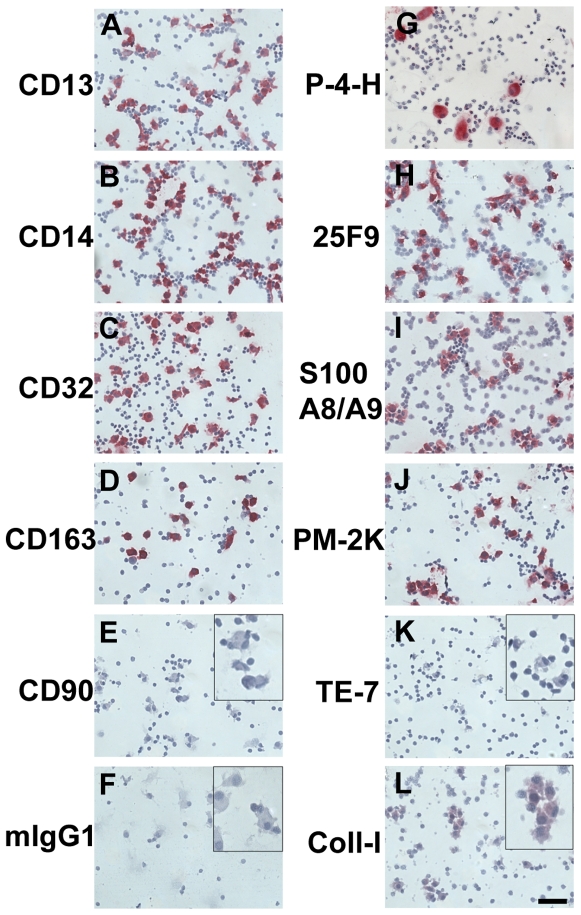
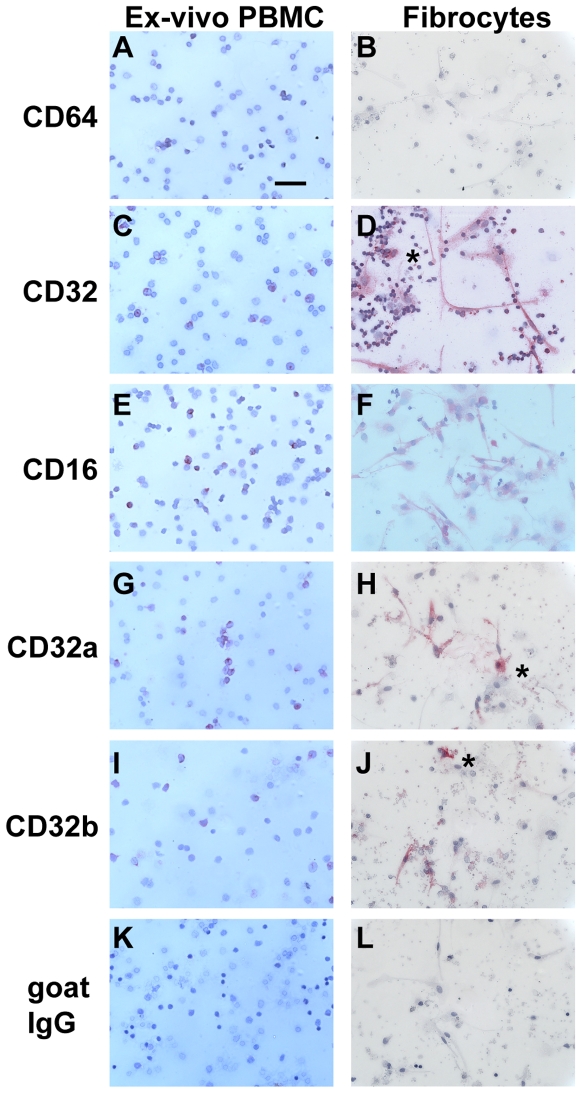
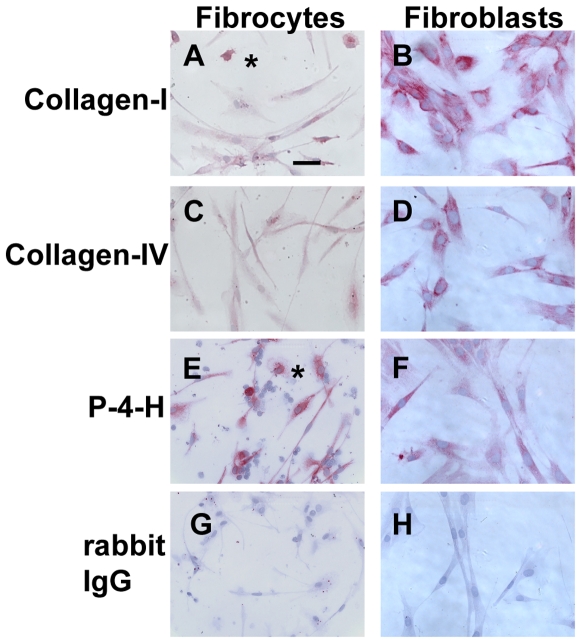
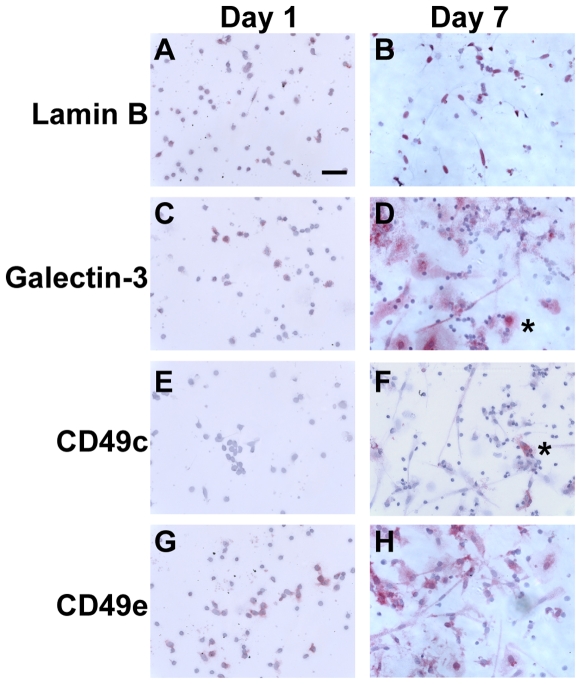
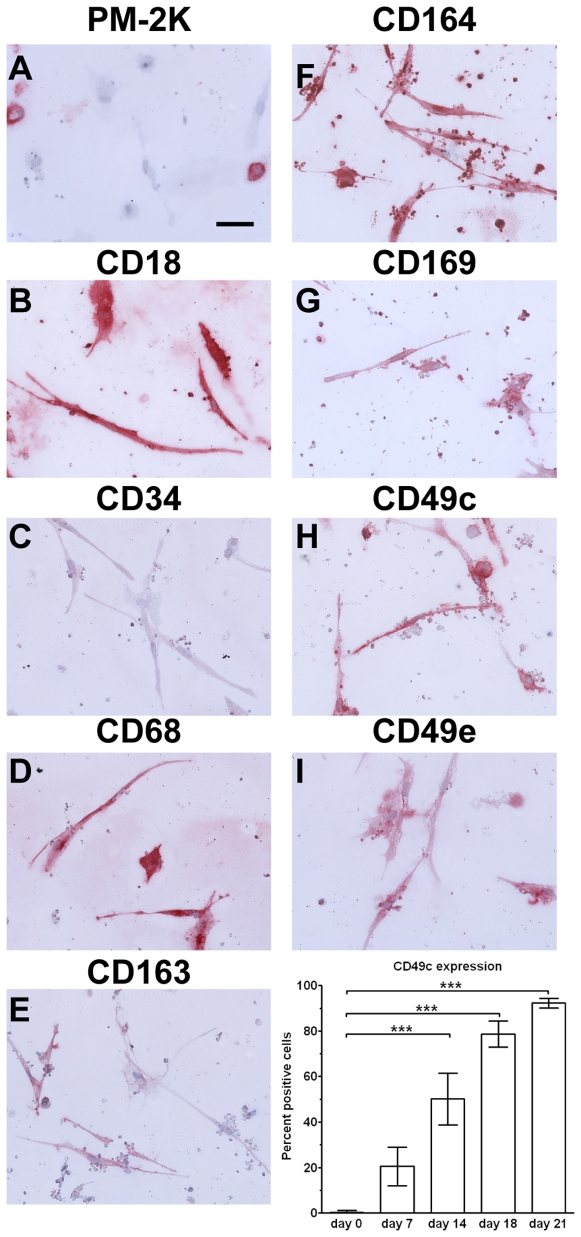
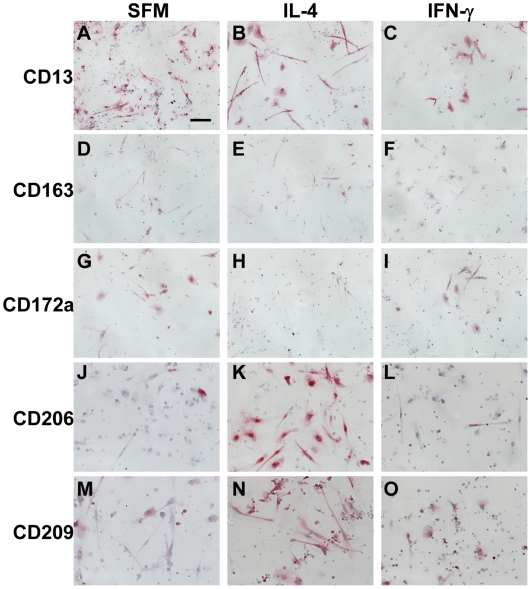
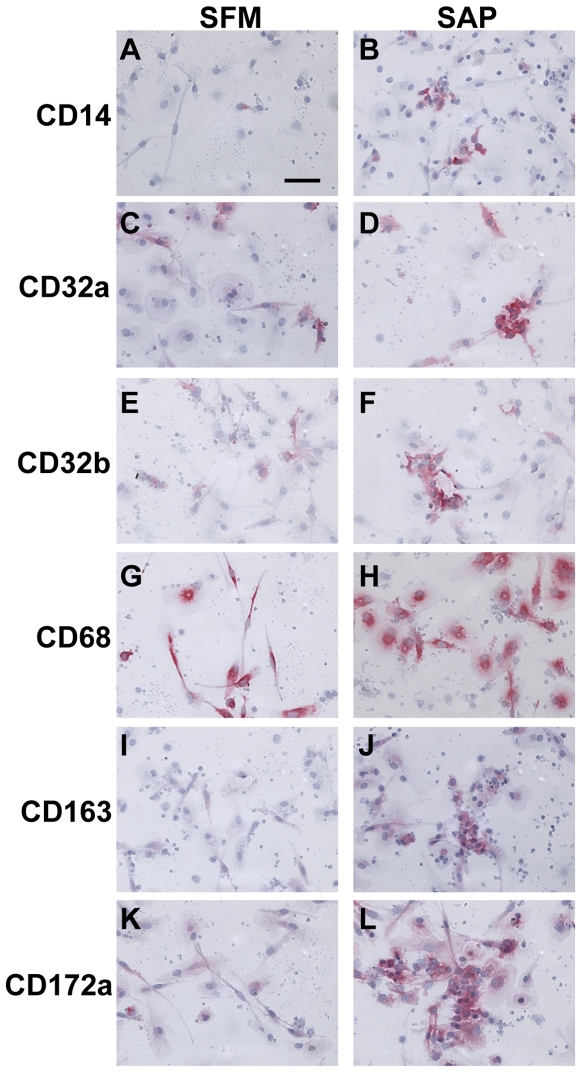
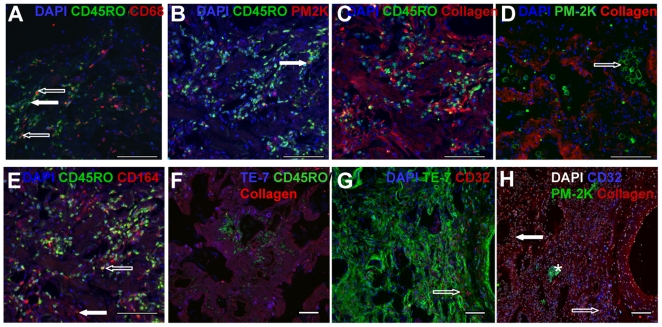
Methodology/principal findings: We have identified markers that discriminate between human peripheral blood monocytes, tissue macrophages, fibrocytes, and fibroblasts. Amongst these four cell types, only peripheral blood monocytes express the combination of CD45RO, CD93, and S100A8/A9; only macrophages express the combination of CD45RO, 25F9, S100A8/A9, and PM-2K; only fibrocytes express the combination of CD45RO, 25F9, and S100A8/A9, but not PM-2K; and only fibroblasts express the combination of CD90, cellular fibronectin, hyaluronan, and TE-7. These markers are effective both in vitro and in sections from human lung. We found that markers such as CD34, CD68, and collagen do not effectively discriminate between the four cell types. In addition, IL-4, IL-12, IL-13, IFN-gamma, and SAP differentially regulate the expression of CD32, CD163, CD172a, and CD206 on both macrophages and fibrocytes. Finally, CD49c (alpha3 integrin) expression identifies a subset of fibrocytes, and this subset increases with time in culture.

Conclusions/significance: These results suggest that discrimination of monocytes, macrophages, fibrocytes, and fibroblasts in fibrotic lesions is possible, and this may allow for an assessment of fibrocytes in fibrotic diseases.


Conflict of interest statement

Competing Interests: Rice University has patent applications on the use of SAP to inhibit fibrosis, and this intellectual property has been licensed to Promedior. DP and RHG are founding members of, have equity in, and receive royalties from Promedior.

Figures

Figure 1
Figure 1. Expression of markers on monocytes, macrophages, fibrocytes, and fibroblasts.
Combined data on the expression of markers on the cells analyzed.
Figure 2
Figure 2. Expression of CD13, CD14, and CD45 isoforms on fibrocytes.
PBMC were cultured in SFM at 5×10⁵ cells/ml in 8-well glass slides for 7 days. Cells were then air-dried, fixed, and stained with antibodies. A) CD13, B) CD14, C) CD45RA, D) CD45RB, E) CD45RO, F) Irrelevant mouse IgG2a control. Cells were then counterstained with hematoxylin to identify nuclei. Positive staining was identified by red staining, with nuclei counterstained blue. Solid arrow points to a fibrocyte, open arrow points to a macrophage, and asterisk indicates a cluster of lymphocytes. Photomicrographs are representative results from at least four different donors. Bar is 50 µm.
Figure 3
Figure 3. Expression of markers on fibrocytes, fibroblasts, and endothelial cells.
PBMC were cultured as described in Figure 1. Normal human dermal fibroblasts and HUVECs were cultured for 2 days in 8-well glass slides. Cells were then air-dried, fixed, and stained with antibodies against A–C) CD43, D–F) CD44, G–I) CD45, J–L) LSP-1, and M–O) CD29. Cells were then counterstained with hematoxylin to identify nuclei. Bar is 50 µm.
Figure 4
Figure 4. Comparison of markers on PBMC ex-vivo and fibrocytes.
PBMC were cultured in SFM at 5×10⁵ cells/ml in 8-well glass slides for 1 hour (ex vivo) or 7 days. Cells were then air-dried, fixed, and stained with antibodies. A and B) CD35, C and D) CD93, E and F) S100A8/9, G and H) 25F9, and I and J) PM-2K. Cells were then counterstained with hematoxylin to identify nuclei. Bar is 50 µm.
Figure 5
Figure 5. Detection of surface markers on monocytes by flow cytometry.
PBMC were stained with mouse monoclonal antibodies and then analyzed by flow cytometry. Monocytes were identified by their forward and side scatter characteristics and the expression of CD14. Histograms show fluorescence intensity of isotype control antibody (black line) compared to the indicated marker (red line) on monocytes. Flow cytometry plots are representative results from six separate donors. Graph shows the percent positive monocytes expressed as the mean±SEM (n = 6 separate donors).
Figure 6
Figure 6. Expression of monocyte/macrophage markers on fibrocytes.
PBMC were cultured as described in Figure 1. Cells were then air-dried, fixed, and stained with antibodies against A) CD18, B) CD68, C) CD163, D) CD206, E) CD209, and F) mouse IgG1 control. Cells were then counterstained with hematoxylin to identify nuclei. Bar is 50 µm.
Figure 7
Figure 7. Comparison of fibroblast markers on fibrocytes, fibroblasts, and HUVECs.
PBMC were cultured as described in Figure 1. Normal human dermal fibroblasts (NHDFb) and HUVECs were cultured for 2 days in 8-well glass slides. Cells were then air-dried, fixed, and stained A–C) for CD90, D–F) for TE-7, G–I) for CD164, J–L) with HA-BP, and M–O) for cellular fibronectin. Cells were then counterstained with hematoxylin to identify nuclei. Bar is 50 µm.
Figure 8
Figure 8. Expression of markers on macrophages cultured in serum and M-CSF.
PBMC were cultured in SFM at 5×10⁵ cells/ml in 8-well glass slides for 7 days in the presence of 10% FCS and 10 ng/ml M-CSF. Cells were then air-dried, fixed and stained with 5 µg/ml mouse IgG1 monoclonal antibodies against CD13, CD14, CD32, CD163, CD90, mouse IgG1, proyly-4-hydroxylase, 25F9, S100A8/A9, PM-2K, TE-7, and collagen-I. Cells were then counterstained with hematoxylin to identify nuclei. Inserts indicate staining at higher magnification. Bar is 50 µm.
Figure 9
Figure 9. Comparison of Fc receptors on PBMC ex-vivo and fibrocytes.
PBMC were cultured in SFM at 5×10⁵ cells/ml in 8-well glass slides for 1 hour (ex vivo) or 7 days. Cells were then air-dried, fixed, and stained with antibodies against A and B) CD64, C and D) CD32, E and F) CD16, G and H) CD32a, I and J) CD32b, or K and L) goat IgG control antibodies. Cells were then counterstained with hematoxylin to identify nuclei. Asterisks are to the right of macrophages. Bar is 50 µm.
Figure 10
Figure 10. Comparison of collagen expression on fibrocytes and fibroblasts.
PBMC were cultured as described in Figure 1. Normal human dermal fibroblasts were cultured for 2 days in 8-well glass slides. Cells were then air-dried, fixed, and stained with antibodies. A and B) collagen-I, C and D) collagen IV, E and F) proyly-4-hydroxylase, G and H) rabbit IgG control antibody. Cells were then counterstained with hematoxylin to identify nuclei. Asterisks are to the right of macrophages. Bar is 50 µm.
Figure 11
Figure 11. Expression of markers on fibrocytes cultured for 21 days.
PBMC were cultured in SFM at 5×10⁵ cells/ml in 8-well glass slides for 21 days. Cells were then air-dried, fixed, and stained with antibodies. A) PM-2K, B) CD18, C) CD34, D) CD68, E) CD163, F) CD164, G) CD169, H) CD49c, and I) CD49e. Cells were then counterstained with hematoxylin to identify nuclei. Bar is 50 µm. Graph shows the percent positive CD49c (α3 integrin) expression over 21 days in culture. At least 100 elongated cells with oval nuclei were examined from at least 10 randomly selected fields, and the percentage of elongated cells that were positively stained by antibodies against the indicated markers is expressed as the mean±SEM (n = 5 separate donors). *** indicates p<0.001, as determined by ANOVA.
Figure 12
Figure 12. Comparison of markers on PBMC cultured for 1 day and day 7 fibrocytes.
PBMC were cultured in SFM at 5×10⁵ cells/ml in 8-well glass slides for 1 or 7 days. Cells were then air-dried, fixed, and stained with antibodies. A and B) Lamin B, C and D) galectin-3, E and F) CD49c, and G and H) CD49e. Cells were then counterstained with hematoxylin to identify nuclei. Asterisks indicate macrophages. Bar is 50 µm.
Figure 13
Figure 13. Effect of cytokines on markers expressed by fibrocytes.
PBMC were cultured in 8-well glass slides in SFM for 7 days, in the presence or absence of IL-4, or IFN-γ. Cells were then air-dried, fixed, and stained with antibodies. A–C) CD13, D–F) CD163, G–I) CD172a, J–L) CD206, and M–O) CD209. Cells were counterstained with hematoxylin to identify nuclei. Bar is 50 µm.
Figure 14
Figure 14. Effect of SAP on markers expressed by macrophages.
PBMC were cultured in 8-well glass slides in SFM for 7 days, in the presence or absence of SAP. Cells were then air-dried, fixed, and stained with antibodies. A–B) CD14, C–D) CD32a, E–F) CD32b, G–H) CD68, I–J) CD163, and K–L) CD172a. Cells were counterstained with hematoxylin to identify nuclei. Bar is 50 µm.
Figure 15
Figure 15. Identification of fibrocytes in pathological samples.
“HOPE-fixed” human lung tissue sections were stained with antibodies against CD32, CD45RO, CD68, CD164, collagen-I, PM-2K, and TE-7. Sections were stained for A) CD45RO (green), CD68 (red) and DAPI (blue). An example of a CD45RO positive lymphocyte is indicated with a solid arrow. Dual labeled CD45RO and CD68 macrophages and fibrocytes are indicated by open arrows. B) CD45RO (green), PM-2K (red) and DAPI (blue). An example of a dual labeled CD45RO and PM-2K tissue macrophage is indicated with a solid arrow. C) CD45RO (green), collagen-I (red), and DAPI (blue). Dual labeled CD45RO and collagen-I positive cells are yellow. D) PM-2K (green), collagen-I (red), and DAPI (blue). A cluster of PM-2K positive alveolar macrophages is indicated with an open arrow. E) CD45RO (green), CD164 (red), and DAPI (blue). An area of CD164 positive fibroblasts is indicated with a solid arrow. A dual labeled CD45RO and CD164 positive fibrocyte is indicated by an open arrow. F) CD45RO (green), collagen-I (red), and TE-7 (blue). Dual positive TE-7/collagen-I fibroblasts are magenta. G) TE-7 (green), CD32 (red), and DAPI (blue). An example of CD32 positive fibrocytes is indicated with an open arrow. H) Nuclei (white), PM-2K (green), collagen (red), and CD32 (blue). A cluster of PM-2K positive alveolar macrophages are indicated with an asterisk. An area of CD32 and collagen positive/PM-2K negative fibrocytes is indicated with an open arrow. An area of collagen positive/CD32 negative fibroblasts is indicated with a solid arrow. Cells were counterstained with DAPI to identify nuclei. Bars are 100 µm.

References

    1. Martin P. Wound Healing—Aiming for Perfect Skin Regeneration. Science. 1997;276:75–81. - PubMed
    1. Singer AJ, Clark RA. Cutaneous wound healing. New England Journal Of Medicine. 1999;341:738–746. - PubMed
    1. Pittenger MF, Mackay AM, Beck SC, Jaiswal RK, Douglas R, et al. Multilineage potential of adult human mesenchymal stem cells. Science. 1999;284:143–147. - PubMed
    1. Phinney DG, Prockop DJ. Concise review: mesenchymal stem/multipotent stromal cells: the state of transdifferentiation and modes of tissue repair—current views. Stem Cells. 2007;25:2896–2902. - PubMed
    1. Kalluri R, Neilson EG. Epithelial-mesenchymal transition and its implications for fibrosis. Journal Of Clinical Investigation. 2003;112:1776–1784. - PMC - PubMed

Publication types