

Optical coherence tomography grading correlates with MRI T2 mapping and extracellular matrix content
- PMID: 19834953
- PMCID: PMC5823006
- DOI: 10.1002/jor.20998
Optical coherence tomography grading correlates with MRI T2 mapping and extracellular matrix content
Abstract
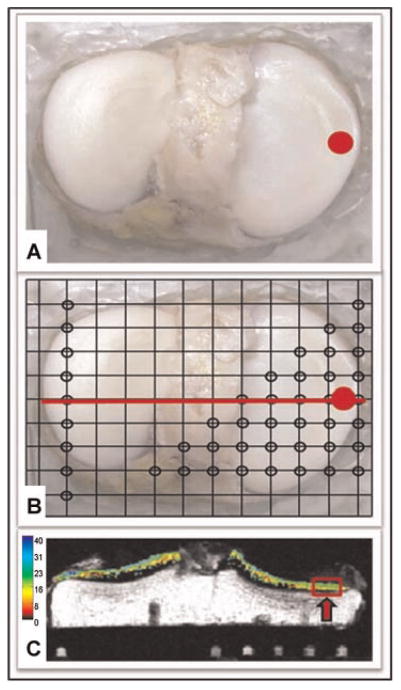
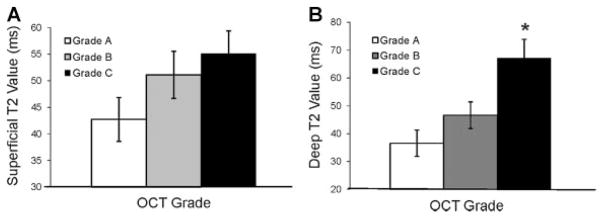
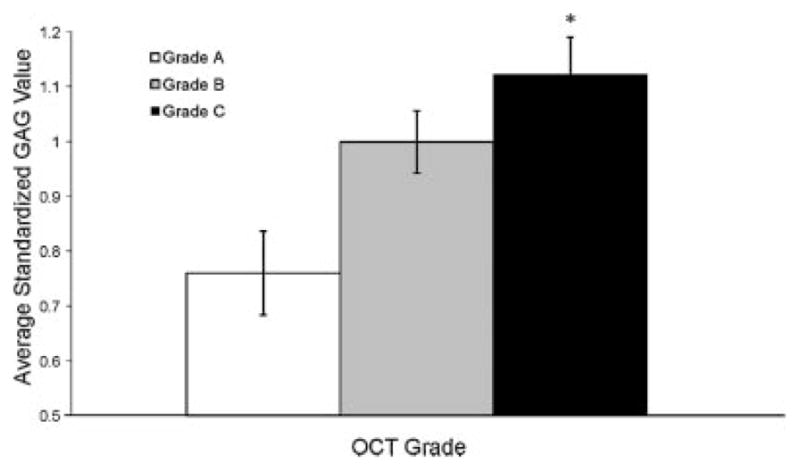
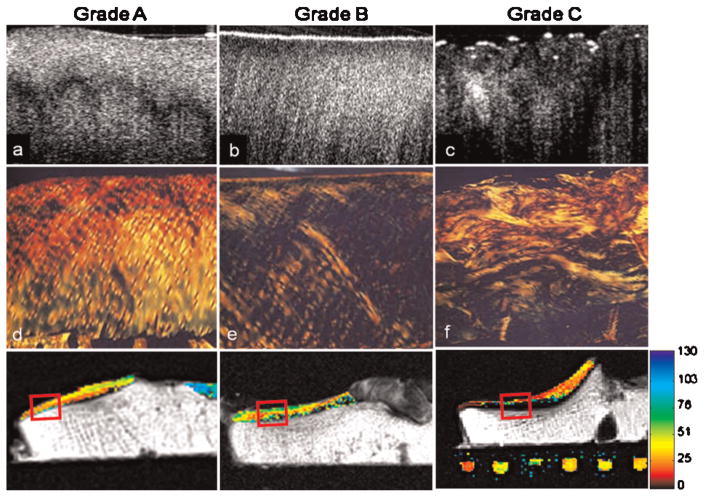
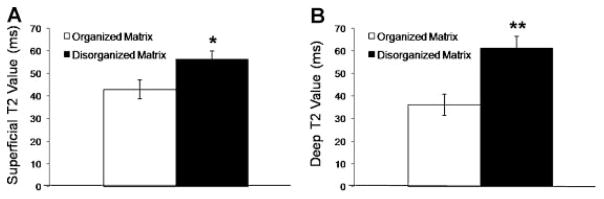
Optical coherence tomography (OCT) and T2 mapping are emerging clinical imaging technologies with potential to detect subsurface changes in cartilage retaining a macroscopically intact articular surface. This study tests the hypothesis that OCT correlates with magnetic resonance imaging (MRI) T2 values, and that OCT signal is sensitive to cartilage matrix degeneration. Forty-five osteochondral cores were harvested from five human tibial plateau explants after MRI T2 mapping. Cores underwent OCT imaging and were graded as follows: A, obvious birefringence; B, no birefringence; C, subsurface voids and/or irregular surface. Extracellular matrix content was determined and cores underwent histologic and polarized light microscopy (PLM) evaluation. Grade B and C cores had 25% higher superficial T2 values (p = 0.047) and 50% higher deep T2 values (p = 0.012) than grade A cores. Grade B and C cores had 36% higher glycosaminoglycan (GAG) content compared to grade A cores (p = 0.009). Histology and PLM demonstrated increased surface irregularity and structural disorganization with increasing OCT grade. OCT grade and T2 value increased with increasing collagen disorganization, suggesting that MRI T2 mapping and OCT are sensitive to changes in collagen structure. Our results demonstrate the ability of OCT and T2 mapping to detect early cartilage degeneration in clinically normal appearing cartilage.
Figures
References
-
- Lawrence RC, Helmick CG, Arnett FC, et al. Estimates of the prevalence of arthritis and selected musculoskeletal disorders in the United States. Arthritis Rheum. 1998;41:778–799. - PubMed
-
- Hootman JM, Helmick CG. Projections of US prevalence of arthritis and associated activity limitations. Arthritis Rheum. 2006;54:226–229. - PubMed
-
- Felson DT, Neogi T. Osteoarthritis: is it a disease of cartilage or of bone? Arthritis Rheum. 2004;50:341–344. - PubMed
-
- Wollheim FA. Serum markers of articular cartilage damage and repair. Rheum Dis Clin North Am. 1999;25:417–432. viii. - PubMed
Publication types
MeSH terms
Substances
Grants and funding
LinkOut - more resources
Full Text Sources
Other Literature Sources
Medical
