Context-dependent perturbation of neural systems in transgenic mice expressing a cytosolic prion protein
- PMID: 19835963
- PMCID: PMC7605312
- DOI: 10.1016/j.neuroimage.2009.10.009
Context-dependent perturbation of neural systems in transgenic mice expressing a cytosolic prion protein
Abstract
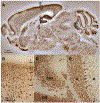
We analyzed the relationship between pathogenic protein expression and perturbations to brain anatomy and physiology in a genetic model of prion disease. In this model, the mouse line 1D4, neuropathology is promoted by accumulation of a cytosolic form of the prion protein (cyPrP). CyPrP distribution was determined and compared with anatomical magnetic resonance imaging (MRI) data, a form of functional MRI based on manganese labeling, and immediate early gene mapping with an antibody to c-Fos. Significant discrepancies between 1D4 and control mice became apparent well in advance of overt behavioral pathology in the mutant mice. Alterations to brain structure and function in the mutants varied among brain regions, however, and differed strikingly even among regions with the highest levels of cyPrP expression. In the cerebellum, gross neurodegeneration was accompanied by increased Mn(2+)-enhanced MRI signal, raising the possibility that compensatory mechanisms act to preserve cerebellar function in the face of massive atrophy. In the hippocampus of 1D4 mice, no significant structural alterations were observed, but both Mn(2+)-enhanced MRI and c-Fos data indicated perturbations to neurophysiology. In the neocortex, there were no clear neural activity differences between 1D4 and control animals, but mutant mice showed significant reduction in cortical thickness. Our finding that distinct combinations of anatomical and functional abnormalities accompanied cyPrP overexpression in different parts of the brain indicates the importance of context in conditioning effects of protein pathogens, and exemplifies the notion that neurodegenerative phenotypes extend beyond cell death and the immediate consequences of atrophy for particular neural systems.
Copyright (c) 2009 Elsevier Inc. All rights reserved.
Figures


Similar articles
-
Cytosolic prion protein toxicity is independent of cellular prion protein expression and prion propagation.J Virol. 2007 Mar;81(6):2831-7. doi: 10.1128/JVI.02157-06. Epub 2006 Dec 20. J Virol. 2007. PMID: 17182694 Free PMC article.
-
The interaction between cytoplasmic prion protein and the hydrophobic lipid core of membrane correlates with neurotoxicity.J Biol Chem. 2006 May 12;281(19):13559-13565. doi: 10.1074/jbc.M512306200. Epub 2006 Mar 14. J Biol Chem. 2006. PMID: 16537534
-
Cytoplasmic prion protein induces forebrain neurotoxicity.Biochim Biophys Acta. 2009 Jun;1792(6):555-63. doi: 10.1016/j.bbadis.2009.02.014. Epub 2009 Mar 10. Biochim Biophys Acta. 2009. PMID: 19281844 Free PMC article.
-
Prion protein transgenes and the neuropathology in prion diseases.Brain Pathol. 1995 Jan;5(1):77-89. doi: 10.1111/j.1750-3639.1995.tb00579.x. Brain Pathol. 1995. PMID: 7767493 Review.
-
A transgenic model of a familial prion disease.Arch Virol Suppl. 2000;(16):103-12. doi: 10.1007/978-3-7091-6308-5_9. Arch Virol Suppl. 2000. PMID: 11214912 Review.
Cited by
-
Prion protein inhibits fast axonal transport through a mechanism involving casein kinase 2.PLoS One. 2017 Dec 20;12(12):e0188340. doi: 10.1371/journal.pone.0188340. eCollection 2017. PLoS One. 2017. PMID: 29261664 Free PMC article.
-
The toxicity of antiprion antibodies is mediated by the flexible tail of the prion protein.Nature. 2013 Sep 5;501(7465):102-6. doi: 10.1038/nature12402. Epub 2013 Jul 31. Nature. 2013. PMID: 23903654
-
Potential of N-acetylated-para-aminosalicylic acid to accelerate manganese enhancement decline for long-term MEMRI in rodent brain.J Neurosci Methods. 2015 Aug 15;251:92-8. doi: 10.1016/j.jneumeth.2015.05.013. Epub 2015 May 22. J Neurosci Methods. 2015. PMID: 26004847 Free PMC article.
-
Selective vulnerability to neurodegenerative disease: the curious case of Prion Protein.Dis Model Mech. 2014 Jan;7(1):21-9. doi: 10.1242/dmm.012146. Dis Model Mech. 2014. PMID: 24396151 Free PMC article. Review.
-
Translation of the prion protein mRNA is robust in astrocytes but does not amplify during reactive astrocytosis in the mouse brain.PLoS One. 2014 Apr 21;9(4):e95958. doi: 10.1371/journal.pone.0095958. eCollection 2014. PLoS One. 2014. PMID: 24752288 Free PMC article.
References
-
- Aguzzi A, Polymenidou M, 2004. Mammalian prion biology: one century of evolving concepts. Cell 116, 313–327. - PubMed
-
- Anderson SA, Frank JA, 2007. MRI of mouse models of neurological disorders. NMR Biomed 20, 200–215. - PubMed
-
- Angenstein F, Niessen HG, Goldschmidt J, Lison H, Altrock WD, Gundelfinger ED, Scheich H, 2007. Manganese-enhanced MRI reveals structural and functional changes in the cortex of Bassoon mutant mice. Cereb. Cortex 17, 28–36. - PubMed
-
- Borchelt DR, Davis J, Fischer M, Lee MK, Slunt HH, Ratovitsky T, Regard J, Copeland NG, Jenkins NA, Sisodia SS, Price DL, 1996. A vector for expressing foreign genes in the brains and hearts of transgenic mice. Genet. Anal 13, 159–163. - PubMed
-
- Bueler H, Fischer M, Lang Y, Bluethmann H, Lipp HP, DeArmond SJ, Prusiner SB, Aguet M, Weissmann C, 1992. Normal development and behaviour of mice lacking the neuronal cell-surface PrP protein. Nature 356, 577–582. - PubMed
Publication types
MeSH terms
Substances
Grants and funding
LinkOut - more resources
Full Text Sources

