. 2009 Oct 14;17(10):1398-410.
doi: 10.1016/j.str.2009.08.009.

Structure of IL-33 and its interaction with the ST2 and IL-1RAcP receptors--insight into heterotrimeric IL-1 signaling complexes

Affiliations

Structure of IL-33 and its interaction with the ST2 and IL-1RAcP receptors--insight into heterotrimeric IL-1 signaling complexes

Andreas Lingel et al. Structure. .

Abstract

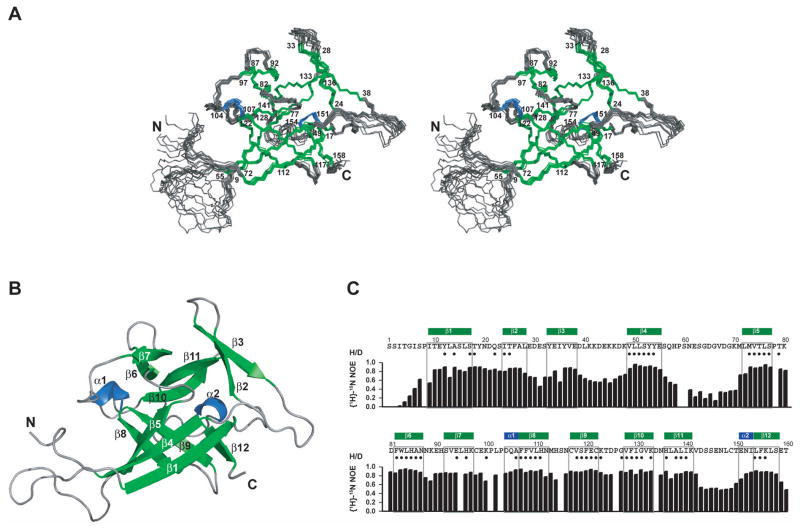
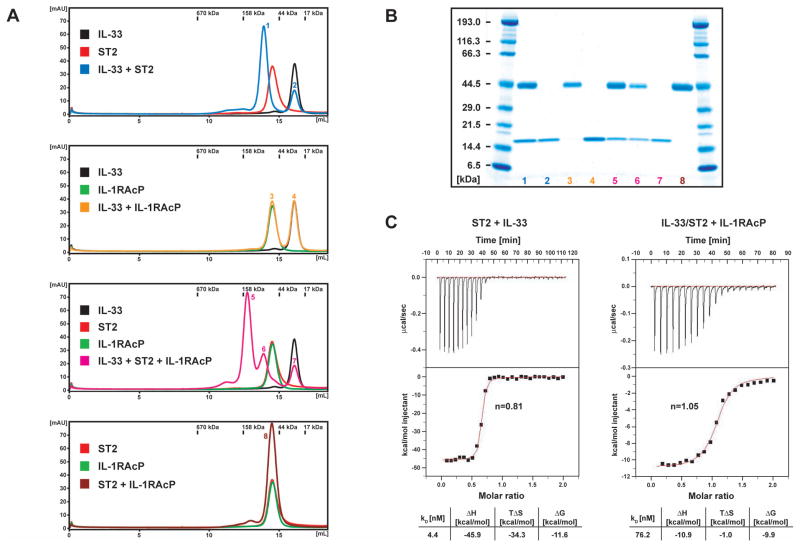
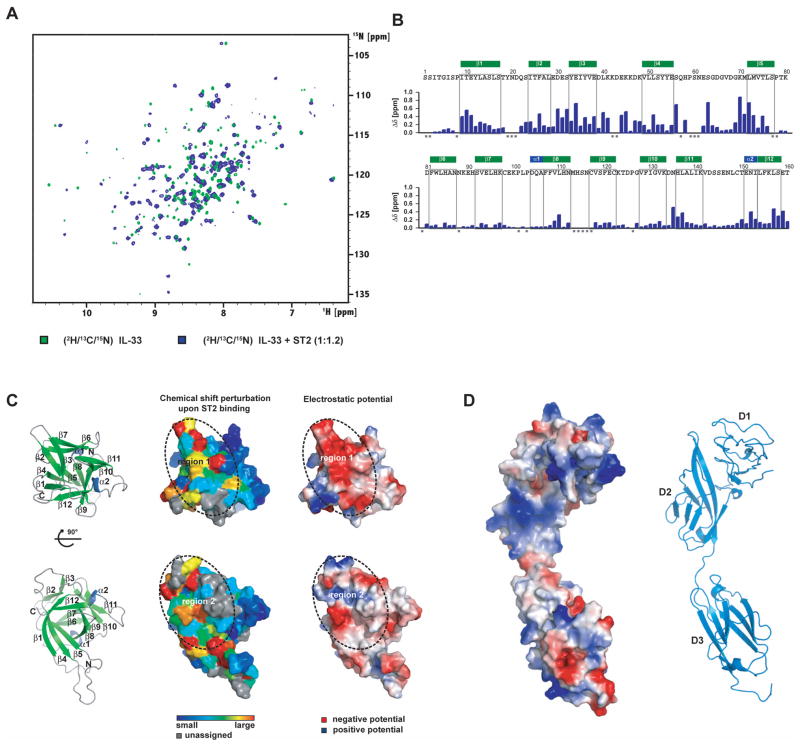
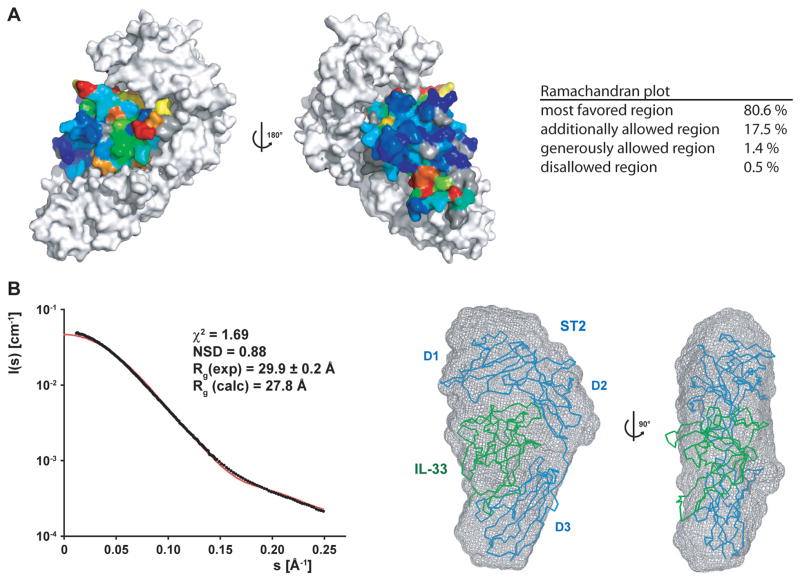
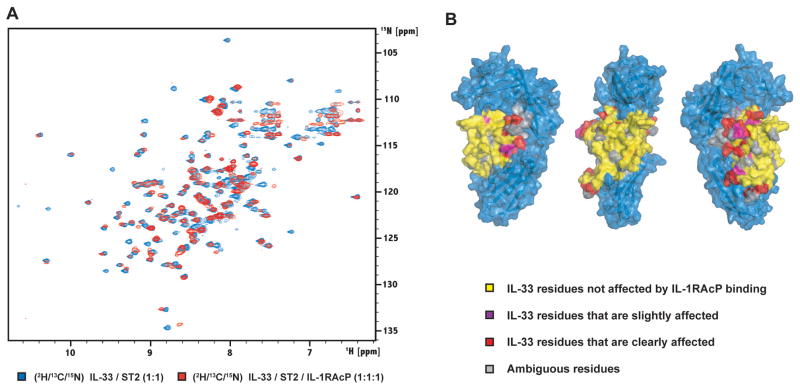
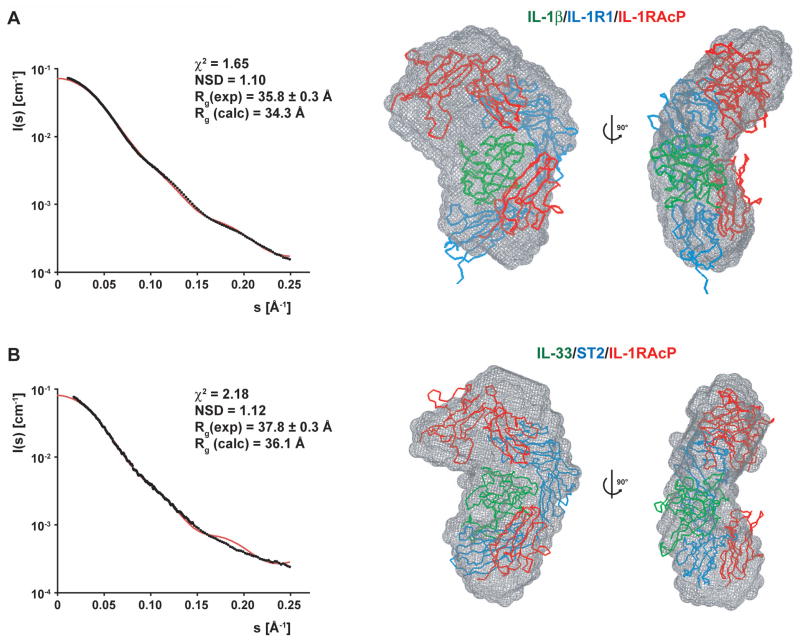
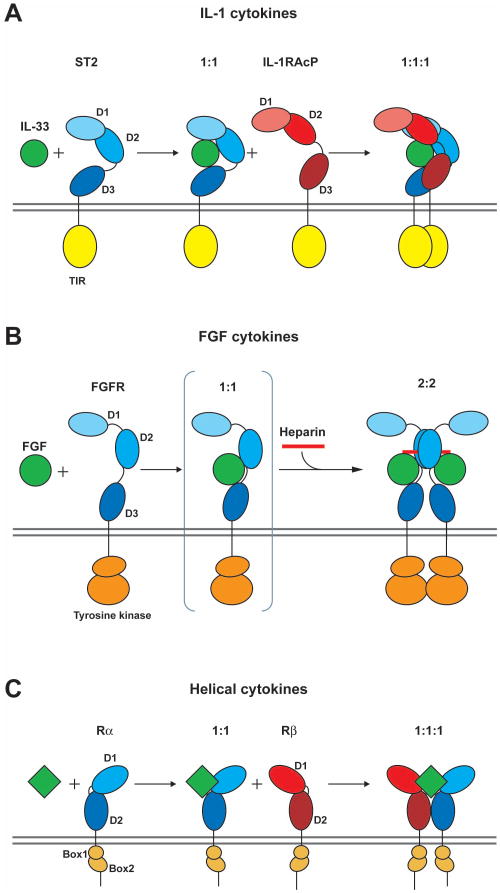
Members of the interleukin-1 (IL-1) family of cytokines play major roles in host defense and immune system regulation in infectious and inflammatory diseases. IL-1 cytokines trigger a biological response in effector cells by assembling a heterotrimeric signaling complex with two IL-1 receptor chains, a high-affinity primary receptor and a low-affinity coreceptor. To gain insights into the signaling mechanism of the novel IL-1-like cytokine IL-33, we first solved its solution structure and then performed a detailed biochemical and structural characterization of the interaction between IL-33, its primary receptor ST2, and the coreceptor IL-1RAcP. Using nuclear magnetic resonance data, we obtained a model of the IL-33/ST2 complex in solution that is validated by small-angle X-ray scattering (SAXS) data and is similar to the IL-1beta/IL-1R1 complex. We extended our SAXS analysis to the IL-33/ST2/IL-1RAcP and IL-1beta/IL-1R1/IL-1RAcP complexes and propose a general model of the molecular architecture of IL-1 ternary signaling complexes.


Figures

Figure 1
Figure 1. Solution structure and backbone dynamics of IL-33
(A) Stereo view of the IL-33 ensemble. The ensemble of the 10 lowest-energy NMR structures is shown. Helices are shown in blue, β-strands in green. Secondary structure elements are labeled by residue numbers (numbering is based on the proposed caspase-1 cleavage site). (B) Ribbon representation of IL-33, secondary structure elements are labeled. (C) Additional NMR data on IL-33. The secondary structure is shown above the sequence. Solvent-protected amide protons (slow H/D exchange in NMR measurements) are indicated by filled circles. Heteronuclear {1H}-15N NOE data (black bars) report regions of IL-33 that are rigid and regions of increased backbone dynamics.
Figure 2
Figure 2. Binding of IL-33 to ST2 and IL-1RAcP
(A) Size exclusion chromatography analysis Left: Individual proteins were mixed and analyzed on a Superdex 200 10/300 GL column. The color of the individual traces matches the labeled boxes and numbers on peaks in the profiles correspond to lanes in the gel shown in (B). Protein molecular weights of a gel filtration standard are indicated above the chromatograms. (B) SDS-Page of the individual peaks of the size exclusion chromatography analysis shown in (A). (C) ITC binding curves. ST2 was titrated with IL-33 (left) and the IL-33/ST2 complex was titrated with IL-1RAcP (right). The binding curves were fit with a 1:1 binding model, resulting in the deduced stoichiometry n and the thermodynamic parameters listed in the table.
Figure 3
Figure 3. NMR analysis of ST2 binding to IL-33
(A) Chemical shift perturbation after addition of ST2 to 2H/13C/15N-labeled IL-33. Chemical shifts were monitored in 1H, 15N TROSY correlation spectra at 800 MHz 1H Larmor frequency. Slow exchange on the NMR chemical shift timescale between free and bound states indicates tight binding with nanomolar affinity. (B) Bar diagram of chemical shift perturbations. Δδ is the weighted chemical shift change of IL-33 backbone amides upon addition of ST2 (see Supplemental Experimental Procedures). Gray squares indicate prolines and unassigned residues. (C) Ribbon representation of the two binding regions, surface coloring according to chemical shift change and electrostatic surfaces of IL-33. Left panel: ribbon representation of IL-33 in the same orientation as in the other panels. The views in the upper and lower panel are correlated by a 90° rotation around the x-axis. Middle panel: Surface representation of IL-33 with residues colored according to the chemical shift perturbation upon binding of ST2. Prolines and unassigned residues are shown in gray. The two regions of major chemical shift changes are outlined by a dotted line and labeled. Right panel: Surface representation of IL-33 colored by electrostatic potential. White, blue and red corresponds to neutral, positive and negative electrostatic potential, respectively. (D) Electrostatic surface and ribbon representation of the ST2 model Surface representation of the ST2 model colored by electrostatic potential. A ribbon diagram is shown in the same orientation with the individual Ig domains labeled.
Figure 4
Figure 4. Model and SAXS validation of the IL-33/ST2 complex
(A) A model of the IL-33/ST2 complex was generated based on chemical shift perturbation data on IL-33 and homology to the IL-1β/IL-1R1 complex using the molecular docking software HADDOCK. The surface of the ST2 receptor is shown in white, whereas the residues of IL-33 are colored according to the degree of chemical shift change (same coloring scheme as in Figure 3C). The views are correlated by a 180° rotation around the y-axis. The Ramachandran plot statistics are shown on the right. (B) SAXS analysis of the IL-33/ST2 complex. Left: The experimental (black dots) and back-calculated scattering curves (red line) of the IL-33/ST2 complex are shown, the scattering intensities are displayed as a function of the momentum transfer s. The fitting statistics are shown above the two curves. Right: The IL-33/ST2 model was placed into the ab initio SAXS envelope; two orientations related by a 90° rotation are shown. IL-33 is colored in green and ST2 in blue.
Figure 5
Figure 5. Binding of the co-receptor monitored by NMR
(A) Chemical shift perturbation after addition of IL-1RAcP to 2H/13C/15N-labeled IL-33 in complex with ST2. Chemical shifts were monitored in 1H, 15N TROSY correlation spectra at 900 MHz 1H Larmor frequency. Slow exchange on the NMR chemical shift timescale between free and bound states indicates tight binding with sub-micromolar affinity. (B) IL-33 residues are colored according to the different classes used to analyze chemical shift perturbations upon addition of the IL-1RAcP co-receptor to the IL-33/ST2 complex (see text). The surface of ST2 is shown in blue.
Figure 6
Figure 6. Characterization of the IL-1β/IL-1R1/IL-1RAcP and IL-33/ST2/IL-1RAcP complexes by SAXS analysis
(A) SAXS data from the IL-1β/IL-1R1/IL-1RAcP complex. Left: The experimental scattering curve is shown with black dots, the scattering profile of the IL-1β/IL-1R1/IL-1RAcP model is shown as a red line. The fitting statistics are shown above the two curves. Right: The IL-1β/IL-1R1/IL-1RAcP model was placed into the ab initio SAXS envelope; two orientations related by a 90° rotation are shown. IL-1β is colored in green, IL-1R1 in blue, and IL-1RAcP in red. (B) SAXS data from the IL-33/ST2/IL-1RAcP complex. Left: The experimental scattering curve is shown with black dots, the scattering profile of the IL-33/ST2/IL-1RAcP model is shown as a red line. The fitting statistics are shown above the two curves. Right: The IL-33/ST2/IL-1RAcP model was placed into the ab initio SAXS envelope; two orientations related by a 90° rotation are shown. IL-33 is colored in green, ST2 in blue and IL-1RAcP in red.
Figure 7
Figure 7. Cartoons comparing the formation of active signaling complexes for IL-1, FGF, and helical cytokines
(A) The IL-33 system is shown as a representative for the IL-1 cytokine family. IL-33 (green) is binding to the ST2 receptor (blue): complex formation enables the recruitment of the co-receptor IL-1RAcP (red). In the ternary 1:1:1 complex, the two cytoplasmic TIR domains (yellow) are proximal resulting in activation of the signaling cascade. (B) In contrast, FGF cytokines (green) bind to FGF receptor (blue) forming a 2:2 complex in the presence of heparin (red). The proximity of the intracellular tyrosine kinase domains (orange) leads to activation. (C) In the helical cytokine system, the ternary signaling complex also consists of the cytokine and a pair of receptors (primary Rα and secondary Rβ). This can be a homodimeric pair of receptor chains in the case of growth hormones, or a heterodimeric pair of receptor chains as seen for the short chain helical cytokines like IL-2, IL-4/13 or GMCSF. Activation is achieved by clustering of intracellular chains bearing JAK family kinases bound to conserved, juxtamembrane Box1–2 motifs.

References

    1. Ali S, Huber M, Kollewe C, Bischoff SC, Falk W, Martin MU. IL-1 receptor accessory protein is essential for IL-33-induced activation of T lymphocytes and mast cells. Proc Natl Acad Sci USA. 2007;104:18660–18665. - PMC - PubMed
    1. Arend WP, Palmer G, Gabay C. IL-1, IL-18, and IL-33 families of cytokines. Immunol Rev. 2008;223:20–38. - PubMed
    1. Barksby HE, Lea SR, Preshaw PM, Taylor JJ. The expanding family of interleukin-1 cytokines and their role in destructive inflammatory disorders. Clin Exp Immunol. 2007;149:217–225. - PMC - PubMed
    1. Boraschi D, Bossu P, Ruggiero P, Tagliabue A, Bertini R, Macchia G, Gasbarro C, Pellegrini L, Melillo G, Ulisse E, et al. Mapping of receptor binding sites on IL-1 beta by reconstruction of IL-1ra-like domains. J Immunol. 1995;155:4719–4725. - PubMed
    1. Boraschi D, Tagliabue A. The interleukin-1 receptor family. Vitam Horm. 2006;74:229–254. - PubMed

Publication types

Associated data

LinkOut - more resources