Review
. 2009 Nov;19(11):555-65.
doi: 10.1016/j.tcb.2009.09.003.

Photoactivatable fluorescent proteins for diffraction-limited and super-resolution imaging

Affiliations
Review

Photoactivatable fluorescent proteins for diffraction-limited and super-resolution imaging

Jennifer Lippincott-Schwartz et al. Trends Cell Biol. 2009 Nov.

Abstract

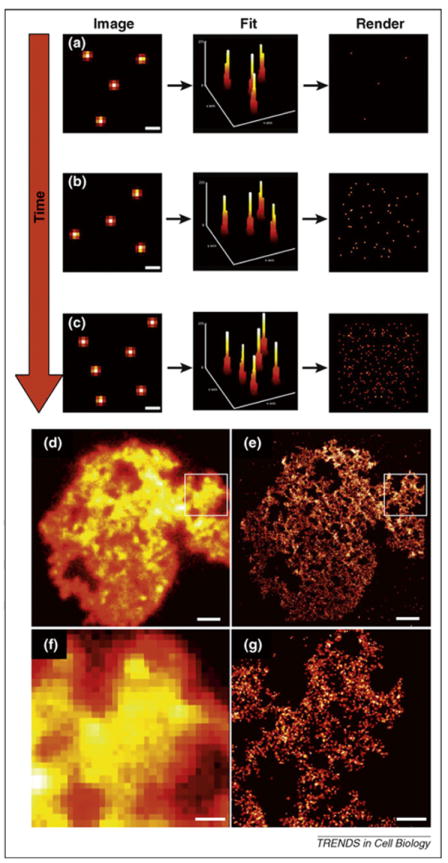
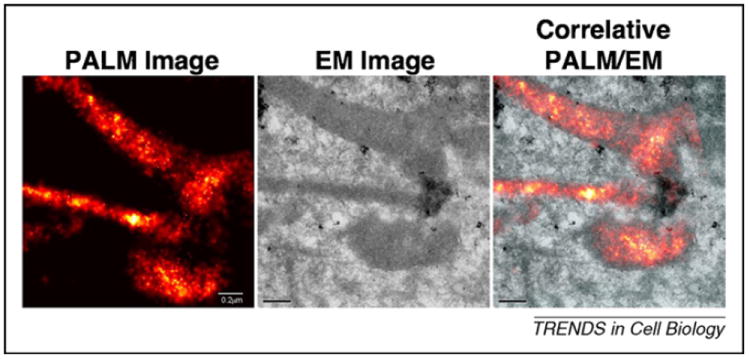
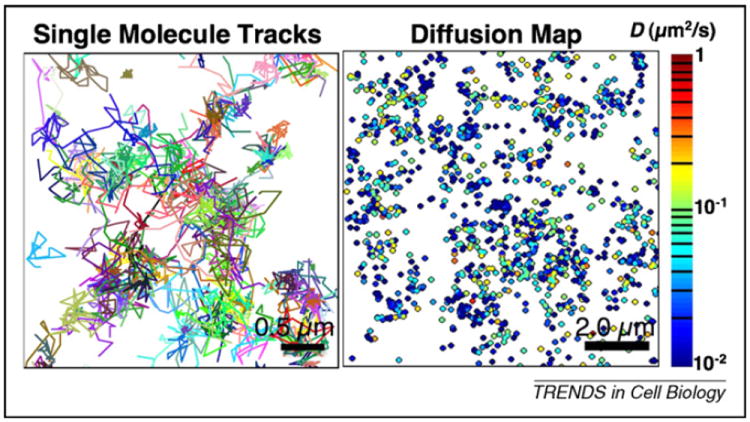
Photoactivatable fluorescent proteins (PA-FPs) are molecules that switch to a new fluorescent state in response to activation to generate a high level of contrast. Over the past eight years, several types of PA-FPs have been developed. The PA-FPs fluoresce green or red, or convert from green to red in response to activating light. Others reversibly switch between 'off' and 'on' in response to light. The optical "highlighting" capability of PA-FPs has led to the rise of novel imaging techniques providing important new biological insights. These range from in cellulo pulse-chase labeling for tracking subpopulations of cells, organelles or proteins under physiological settings, to super-resolution imaging of single molecules for determining intracellular protein distributions at nanometer precision. This review surveys the expanding array of PA-FPs, including their advantages and disadvantages, and highlights their use in novel imaging methodologies.


Figures

Figure 1
Figure 1
Photolabeling of a Golgi pool of PA-GFP-tagged VSVGtsO45. A COS-7 cell expressing a temperature sensitive VSVGtsO45-PA-GFP was transfected and incubated overnight at the non-permissive temperature of ~40 °C. This accumulated the protein in the ER because of the misfolding of the VSVGtsO45. After shifting to the permissive temperature of 32 °C on the microscope stage for ~40 minutes, which releases VSVGtsO45-PA-GFP into the secretory pathway, the Golgi pool of the protein (indicated in the outline in the pre-photoactivation image) was photoactivated with ~400 nm light. Photoactivation resulted in a brighter pool of molecules in the Golgi area (post) that moved from the Golgi to the PM (8 and 36 min). Scale bars are 10 μm. The zoomed view of the 8 min time point shows transport carriers moving from the Golgi apparatus to the PM. Scale bar is 5 μm in the zoom image.
Figure 2
Figure 2
Optical pulse-chase labeling of the PM marker GAP43 fused to EosFP during syncytial divisions in a fly embryo. The data reveal that activated GAP43 fluorescence stays associated with PM regions neighboring individual nuclei and its daughters over time instead of spreading more widely across the PM surface of the embryo. Figure from [43].
Figure 3
Figure 3
Photoactivation and photobleaching of untagged fluorescent proteins. COS-7 cells expressing PA-GFP (a–d) were photoactivated in the nucleus indicated by the red circle and followed as the nuclear fluorescence signal equilibrated with the cytoplasm. Photoactivated fluorescence signals, such as the nuclear pool (d), can be quantified and used to study the kinetics of molecular movement out of the nucleus in this example. Here, the data are normalized to the first post-activation image. For comparison, the nuclear pool in COS-7 cells expressing EGFP (e–h) were photobleached (indicated by the red circle in E) and followed as the fluorescent molecules in the cytoplasm equilibrate with the nucleus. This technique, often called FRAP (fluorescence recovery after photobleaching), is complimentary to photoactivation experiments and used to study the kinetics of molecular movement, such as the movement of EGFP into the nucleus in this example. The graph in H shows the nuclear signal during this FRAP experiment and is normalized to the pre-photobleached image. Scale bars are 10 μm.
Figure 4
Figure 4
Principle of high-density molecular localization achieved by techniques such as PALM, F-PALM and STORM. Techniques falling into this class of imaging are single molecule imaging methods, but the key is to make possible the imaging of single molecules in a field containing hundreds or thousands (a–c). Molecules of interest tagged with fluorescent proteins or other labels that are initially dark and can be photoactivated or switched to a non-fluorescent state are ‘turned on’ in small numbers to maintain a density low enough to distinguish single molecules. Each molecule is precisely localized by a 2D Gaussian fit of the photon distribution rendered in a new image as a Gaussian distribution using the determined x, y coordinates and a size indicated by the uncertainty of fit of the original photon distribution. The photoactivation and imaging of all the molecules within a specimen and summing the diffraction-limited fluorescence results in an image that is equivalent to a conventional optical image (d). But, rendering all of the localized molecules on the same image gives a super-resolution image for these simulated molecules of interest (e). Zoomed images (f) and (g) better demonstrate the level of detail available in the PALM image (g) compared with the conventional image (f). Scale bars in (a–c) are 0.5 μm. Scale bars are 2 μm in (d) and (e) and 0.5 μm in (f) and (g). (d–g) are reprinted from [17].
Figure 5
Figure 5
Correlative PALM/EM images of mitochondria in a cryoprepared thin section from a COS-7 cell expressing a dEosFP-tagged cytochrome c oxidase import sequence. Reprinted from [17].
Figure 6
Figure 6
Super-resolution iPALM image of a FoLu cell expressing farnesylated tdEosFP at the PM, rendered with z-axis color-coding. The areas outlined in white are shown as a z cross-section. Image was kindly provided by Harald Hess and Gleb Shtengel, Janelia Farm Research Campus, Ashburn, VA, USA.
Figure 7
Figure 7
SptPALM imaging of the ts045 vesicular stomatitis virus G protein tagged with Eos (VSVG) expressed in live COS-7 cells. Left panel shows the summed trajectories of localized VSVG-Eos molecules. Each color represents a different track, all of which were longer than 15 frames at a 50 ms/frame rate (scale bar = 0.5 μm). Right panel shows a diffusion map of VSVG-Eos expressing cells. Each point represents the starting position of one trajectory and is color-coded according to the diffusion coefficient (Deff) calculated for the trajectory (see color lookup table on right for values of Deff) (scale bar = 2.0 μm). Reprinted from [63].

References

    1. Tsien RY. The green fluorescent protein. Ann Rev Biochem. 1998;67:509–544. - PubMed
    1. Lukyanov KA, et al. Innovation: photoactivatable fluorescent proteins. Nat Rev Mol Cell Biol. 2005;6:885–891. - PubMed
    1. Lippincott-Schwartz J, Patterson GH. Fluorescent proteins for photoactivation experiments. Methods Cell Biol. 2008;85:45–61. - PubMed
    1. Fernandez-Suarez M, Ting AY. Fluorescent probes for super-resolution imaging in living cells. Nat Rev Mol Cell Biol. 2008;9:929–943. - PubMed
    1. Patterson GH, Lippincott-Schwartz J. A photoactivatable GFP for selective photolabeling of proteins and cells. Science. 2002;297:1873–1877. - PubMed

Substances