. 2009 Oct 16;139(2):285-98.
doi: 10.1016/j.cell.2009.07.047.

Norrin, frizzled-4, and Lrp5 signaling in endothelial cells controls a genetic program for retinal vascularization

Affiliations

Norrin, frizzled-4, and Lrp5 signaling in endothelial cells controls a genetic program for retinal vascularization

Xin Ye et al. Cell. .

Erratum in

  • Cell. 2010 Apr 2;141(1):191

Abstract

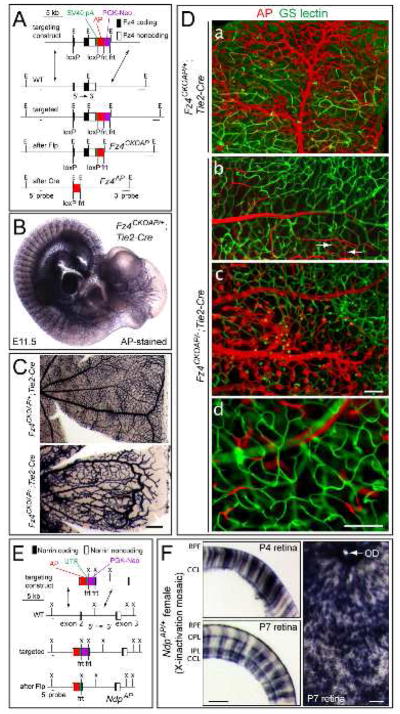
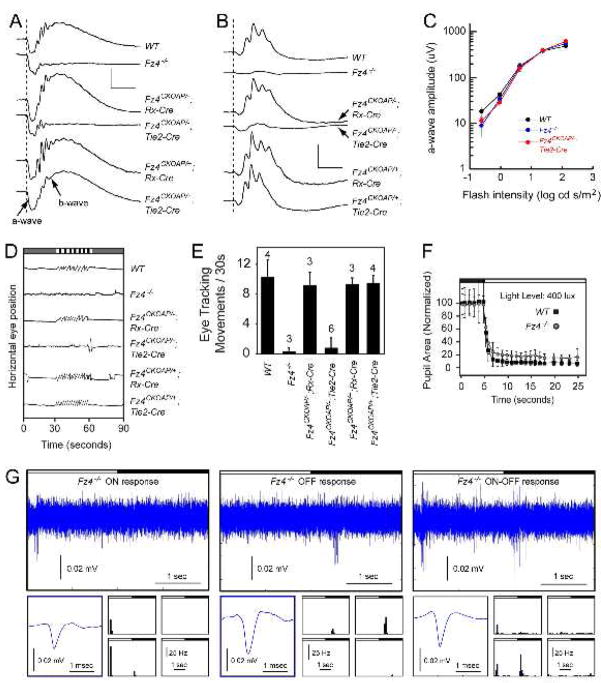
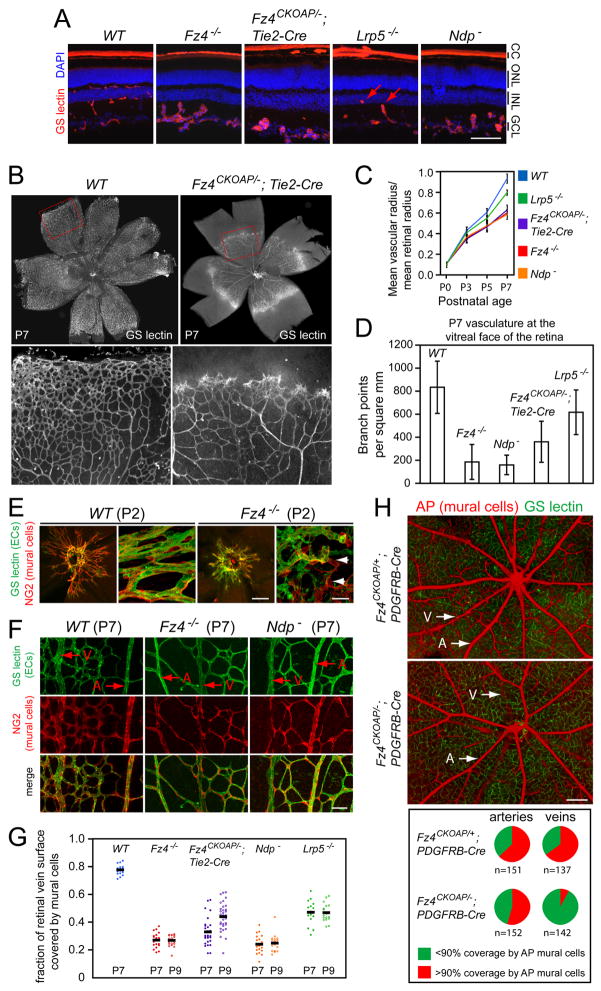
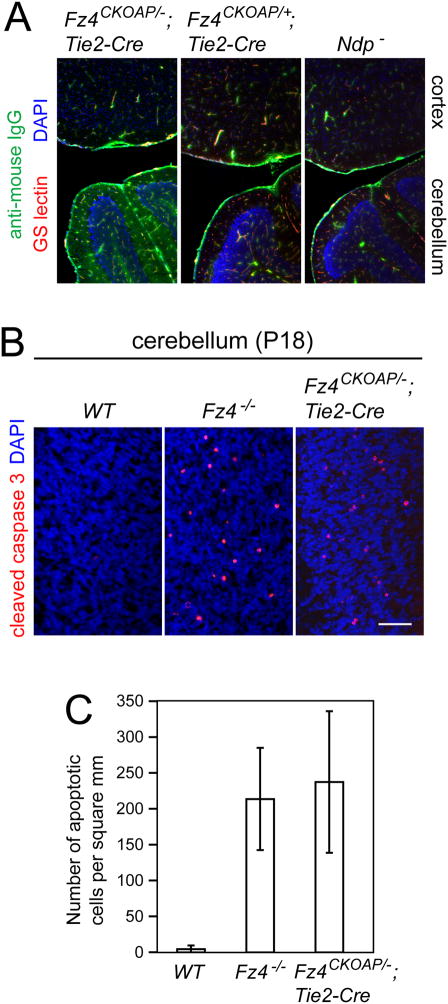
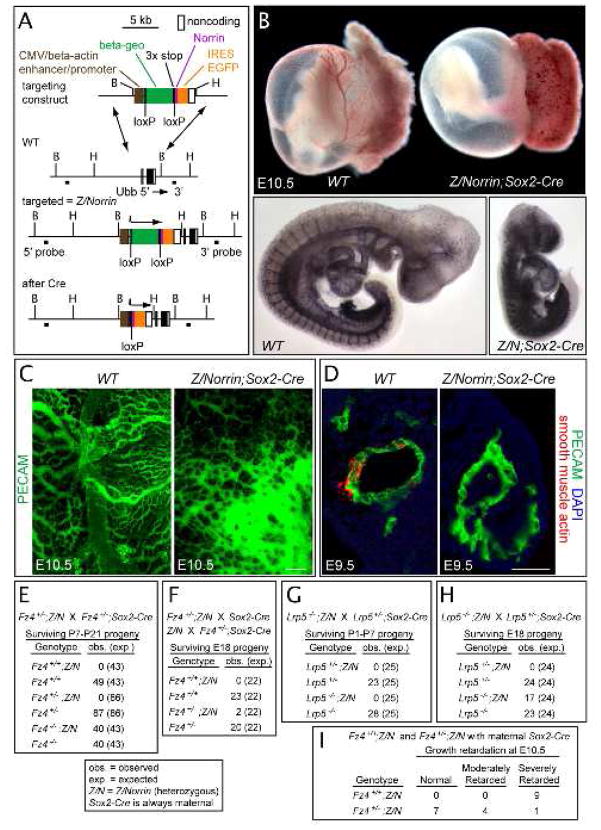
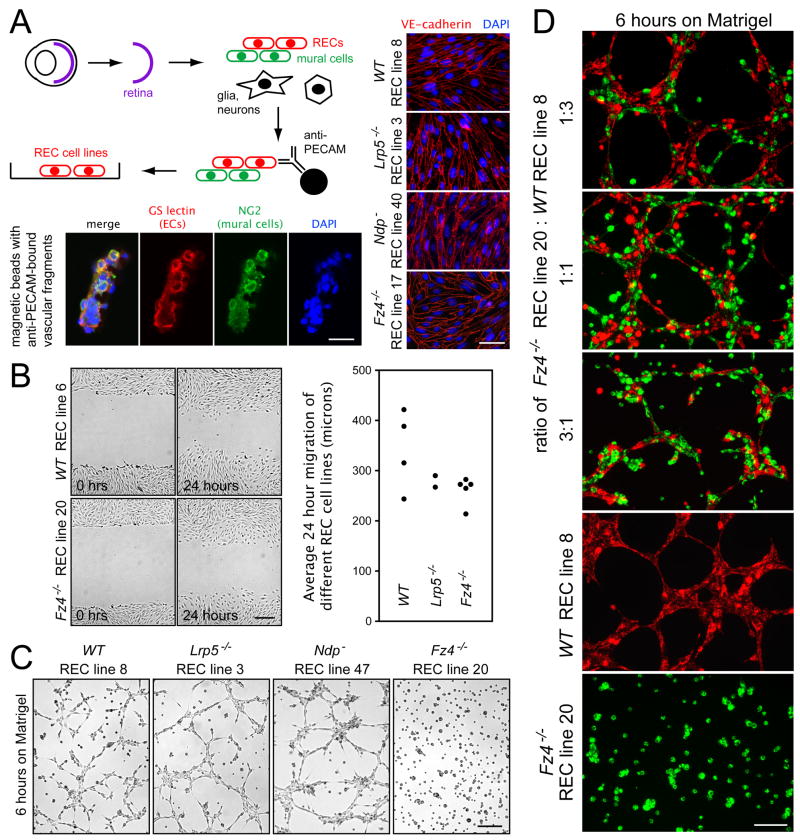
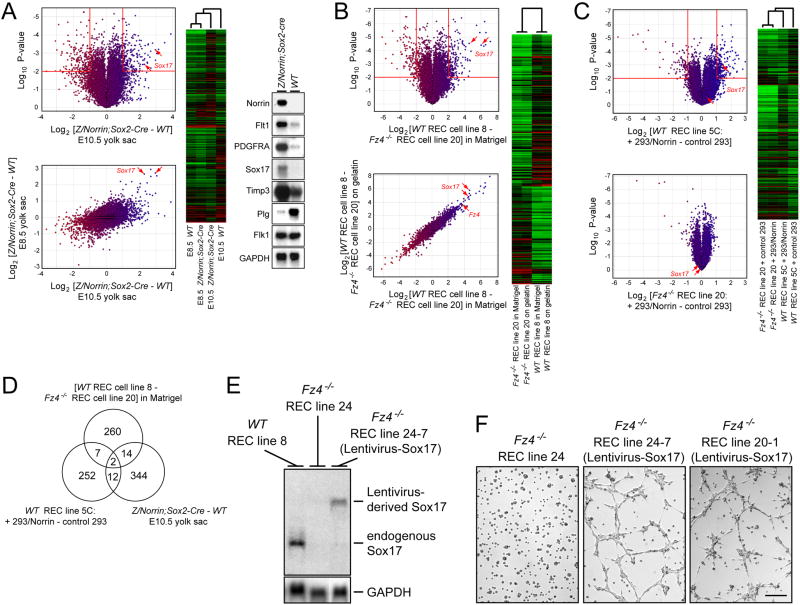
Disorders of vascular structure and function play a central role in a wide variety of CNS diseases. Mutations in the Frizzled-4 (Fz4) receptor, Lrp5 coreceptor, or Norrin ligand cause retinal hypovascularization, but the mechanisms by which Norrin/Fz4/Lrp signaling controls vascular development have not been defined. Using mouse genetic and cell culture models, we show that loss of Fz4 signaling in endothelial cells causes defective vascular growth, which leads to chronic but reversible silencing of retinal neurons. Loss of Fz4 in all endothelial cells disrupts the blood brain barrier in the cerebellum, whereas excessive Fz4 signaling disrupts embryonic angiogenesis. Sox17, a transcription factor that is upregulated by Norrin/Fz4/Lrp signaling, plays a central role in inducing the angiogenic program controlled by Norrin/Fz4/Lrp. These experiments establish a cellular basis for retinal hypovascularization diseases due to insufficient Frizzled signaling, and they suggest a broader role for Frizzled signaling in vascular growth, remodeling, maintenance, and disease.


Figures

Figure 1
Figure 1
Expression of Fz4 in ECs and Ndp in Muller glia: absence of Fz4 signaling in ECs leads to severe defects in retinal vascular development. (A) Structure of the Fz4CKOAP allele. LoxP sites were placed in the 5′ UTR and 3′ of the 3′ UTR. Cre-mediated recombination deletes Fz4 coding sequences and activates AP. E, EcoR I. (B) Fz4 is expressed in ECs as determined by AP histochemistry of a Fz4CKOAP/+;Tie2-Cre E11.5 embryo. (C) AP histochemistry of adult retinas. Fz4AP/+ ECs produce a WT vasculature, and Fz4AP/ ECs produce a vascular phenotype identical to that of Fz4/ mice. Scale bar, 200 um. (D) Mosaic analysis of Fz4CKOAP/+;Tie2-Cre and Fz4CKOAP/;Tie2-Cre retinas with incomplete Cre-mediated recombination. a, Fz4AP/+ ECs populate large vessels and capillaries. b–d, vessels are populated by Fz4AP/ ECs only if they reside on the vitreal surface (b and c); intraretinal growth of Fz4AP/ ECs typically ends in a compact ball of cells (c), with some Fz4AP/ ECs incorporated into the adjacent WT capillary network (white arrows in b). d, rare Tie2-Cre-mediated recombination events generate isolated Fz4AP/ ECs within mature intra-retinal capillaries. Scale bar, 100 um. (E) Structure of the NdpAP allele. UTR, rabbit beta-globin 3′ UTR; X, Xba I. (F) AP-stained retinas from NdpAP/+ female mice. 40 um cross-sections at P4 and P7 (left) and a flat mount at P7 (right). AP+ Muller glia span the full thickness of the retina. The brown dots in the flat mount are adherent RPE cells. Scale bars, 100 um. RPE, retinal pigment epithelium; OPL, outer plexiform layer; IPL, inner plexiform layer, GCL, ganglion cell layer; OD, optic disc.
Figure 2
Figure 2
Deficits in visual function associated with retinal vascular insufficiency (A) Rod ERG responses to a strobe flash (dashed line) presented in darkness. Scale bars, 500 uV and 50 ms. (B) Cone ERG responses to a strobe flash (dashed line) superimposed upon a steady rod-desensitizing adapting field. Scale bars, 200 uV and 50 ms. (C) Amplitude of the dark-adapted a-wave measured 8 ms after the flash, as a function of stimulus intensity. There is no statistically significant difference between control a-waves (averages of Fz4+/+, Fz4+/−, Fz4CKOAP/+;Rx-Cre, and Fz4CKOAP/+;Tie2-Cre) and Fz4−/− and Fz4CKOAP/−;Tie2-Cre a-waves. The number of mice tested were: Fz4+/+ (2), Fz4+/ (4), Fz4CKOAP/+;Rx-Cre (6), Fz4CKOAP/+;Tie2-Cre mice (5), Fz4−/− (7), Fz4CKOAP/−;Rx-Cre (6), and Fz4CKOAP/−;Tie2-Cre (6). Bars, SD. (D) The OKR to horizontally rotating vertical stripes (striped bar at top) is lost in Fz4/ and Fz4CKOAP/;Tie2-Cre mice. (E) Quantification of the OKR. The number of mice tested is indicated. Among six Fz4CKOAP/;Tie2-Cre tested, one showed a weak OKR and was subsequently found to exhibit incomplete Cre-mediated recombination in the retinal vasculature; the remaining five mice showed no OKR. Bars, SD. (F) Fz4/ and WT littermates show nearly normal pupil constriction following the onset of a 400 lux stimulus (open bar at top). For each genotype, four mice were tested six times and the 24 responses averaged. Bars, SD. (G) Extracellular multi-electrode array recordings of light responses from ganglion cell layer neurons from two month old Fz4/ retinas. Upper panels, individual ON, OFF, and ON-OFF cell responses to two seconds of light followed by two seconds of darkness (black and white bars). Shown for each cell is the averaged spike waveform obtained from ten repetitions of the alternating light/dark stimulus (lower left panels) and a peri-stimulus histogram showing the frequency (Hz) and timing of spikes in response to ten repetitions of the stimulus at each of four stimulus locations comprising a 2×2 subset of the 5×5 stimulus array (lower panels; 100 msec bins).
Figure 3
Figure 3
Fz4 signaling is required for retinal vascular growth and for normal EC-MC interactions. (A) WT adult retina show the normal two tiers of capillaries. Fz4/, Fz4CKOAP/;Tie2-Cre, and Ndp retinas fail to develop intraretinal capillaries; Lrp5/ retinas show partial development of the inner tier (red arrows). CC, choriocapillaris; ONL, outer nuclear layer; INL, inner nuclear layer; GCL, ganglion cell layer. Scale bar, 100 um. (B) Delayed EC migration and impoverished vascular network formation in Fz4CKOAP/;Tie2-Cre retinas at P7. Regions boxed in red are shown at higher magnification; the vessels reside on the vitreal surface. Scale bar, 20 um. (C) Quantification of EC spreading from the optic disc. Fz4/, Fz4CKOAP/;Tie2-Cre, and Ndp retinas are equivalently defective; Lrp5/ retinas show a milder defect. For each genotype, 6–10 retinas were analyzed per time point. Bars, SEM. (D) Quantification of vascular density at the vitreal surface. Lrp5/retinas show a mild defect, Fz4CKOAP/;Tie2-Cre retinas show an intermediate defect, and Fz4/ and Ndp retinas show equivalently severe defects. Bars, SEM. (E) P2 retina flat mounts show that MC coverage of ECs in Fz4/ retinas is aberrant from the earliest stages of vascular development (white arrows, detached MCs). a,c, images centered at the optic disc; scale bar, 200 um. b,d, scale bar 20 um. (F) P7 retina flat mounts show decreased MC coverage of capillaries and veins (V), with minimal affect on arteries (A), in Fz4/ and Ndp retinas. Scale bar, 50 um. (G) Quantification of the surface area of the principal retinal veins covered by MCs. Mutant retinas were examined at P7 and P9 because vascular migration is delayed ~2 days (Figure 3B and C). Each data point represents a different vein. Black bars, averages. P7 vs. P9 Fz4CKOAP/;Tie2-Cre (p<0.0001, student t-test); P9 Fz4CKOAP/;Tie2-Cre vs. Fz4/ or Norrin (p<0.0001, ANOVA). Each mutant at either P7 or P9 vs. WT at P7 (p<0.0001, student t-test). (H) Fz4AP/+ and Fz4AP/ MCs visualized at P30 in the Fz4CKOAP/+;PDGFRB-Cre retina (upper panel) and Fz4CKOAP/;PDGFRB-Cre retina (lower panel), respectively. GS-lectin staining shows normal capillary architecture in both retinas. Recombination is more efficient in MCs on large vessels compared to capillaries. Pie charts show MC coverage at P30, with the number of scored veins and arteries indicated. The artery coverage difference is not statistically significant (P=0.162); for the vein coverage, P=10−25 (Fisher’s exact test). Scale bar, 200 um.
Figure 4
Figure 4
Vascular basis of cerebellar degeneration in Fz4/ mice. (A) Loss of vascular integrity occurs in the Fz4CKOAP/;Tie2-Cre cerebellum but not cerebral cortex as determined by staining for IgG in freshly frozen tissue. Scale bar, 300 um. (B,C) Large numbers of apoptotic granule cells in the P18 cerebellum are observed with deletion of Fz4 in ECs. P<10−6 for Fz4CKOAP/;Tie2-Cre vs. WT and for Fz4/ vs. WT (student t-test). Scale bar in B, 50 um. Bars, SEM.
Figure 5
Figure 5
Ubiquitous production of Norrin during embryogenesis leads to vascular disorganization (A) Targeted insertion of a Cre-activated Norrin expression cassette upstream of the Ubb gene. Cre-mediated recombination eliminates a loxP-flanked beta-geo and three transcription termination sites, permitting transcription of Norrin-IRES-EGFP. (B) Upper panel, Z/Norrin;Sox2-Cre embryos have a severe defect in yolk sac vascular development and retarded embryonic growth at E10.5. Lower panels, anti-PECAM immunostaining at E10.5 shows generalized vascular disorganization in a Z/Norrin;Sox2-Cre embryo (right). (C) Flat-mounted E10.5 yolk sacs show an orderly hierarchy of vessel sizes in WT (left), and undeveloped and disorganized vasculature in a Z/Norrin;Sox2-Cre yolk sac (right). Scale bar, 200 um. (D) Dorsal aorta at E9.5. vSMCs are absent in the Z/Norrin;Sox2-Cre aorta. Scale bar, 50 um. (E–I) Lethality caused by ubiquitous Norrin production is suppressed in a Fz4/ background (E), and partially suppressed in Fz4+/ and Lrp5/backgrounds (F–I).
Figure 6
Figure 6
Fz4/ REC lines exhibit defects in the formation of capillary-like structures (A) Diagram of immuno-affinity purification of vascular fragments (upper), and immunohistochemical characterization of isolated fragments (lower; scale bar 20 um) and cloned REC lines (right; scale bar, 50 um). (B) Scratch-induced motility on gelatin-coated dishes. Left, phase contrast images zero and 24 hours after the scratch; right, quantification of cell motility. Scale bar, 200 um. (C) WT, Lrp5/, and Ndp REC lines form capillary-like structures six hours after plating on Matrigel; Fz4/ REC lines do not. Scale bar, 200 um. (D) Matrigel cultures of diI-labeled WT and diO-labeled Fz4/ RECs, mixed immediately before plating at the indicated ratios. Bottom, Matrigel cultures of the pure RECs. Scale bar, 100 um.
Figure 7
Figure 7
Sox17 plays a critical role in the Norrin/Fz4/Lrp-dependent transcriptional program in ECs (A) Norrin-induced changes in transcript abundances in WT vs. Z/Norrin;Sox2-Cre yolk sacs at E8.5 and E10.5. The heat map shows differences greater than 2-fold with a P-value <0.01 in the E10.5 WT vs. Z/Norrin;Sox2-Cre yolk sac comparison (red borders in upper plot). RNA blot hybridization of selected transcripts in E10.5 WT and Z/Norrin;Sox2-Cre yolk sacs confirms increased abundances of Norrin, Flt1, PDGFRA, Sox17, and Timp3 transcripts, decreased abundances of Plasminogen (Plg) transcripts, and unaltered abundance of Flk1 and GAPDH transcripts. Micro-array data in this Figure are averages of three independent experiments. (B) Transcripts differences between WT and Fz4/ REC lines (upper plot) are largely unaffected by growth on Matrigel vs. gelatin (lower plot). The heat map shows differences greater than 4-fold with a P-value <0.01 in WT vs. Fz4/ REC lines (red borders in upper plot). (C) Norrin-induced changes in transcript abundance in WT (upper plot) but not Fz4/ (lower plot) REC lines. The heat map shows differences greater than 2-fold with a P-value <0.01 when WT RECs were co-cultured with 293/Norrin vs. control 293 cells (red borders in upper plot). (D) Venn diagram indicating the overlap among transcripts delimited by the red borders in panels A–C. (E) Sox17 transcripts are undetectable by RNA blotting in Fz4/ RECs (center), but are present in Fz4/ RECs following lentiviral transduction of Sox17 (right) at levels similar to those of WT RECs (left). The image is from one exposure of an RNA blot; for clarity, several lanes between lanes 2 and 3 have been removed. (F) Lentivirus transduction of Sox17 rescues the ability of Fz4/ RECs to form capillary-like structures in Matrigel. Results are shown for two independent Fz4/ REC lines; the defective Matrigel behavior of the parental Fz4/ REC line 20 is shown in Figure 6C.

Comment in

References

    1. Adams RH, Alitalo K. Molecular regulation of angiogenesis and lymphangiogenesis. Nat Rev Mol Cell Biol. 2007;8:464–478. - PubMed
    1. Ai M, Heeger S, Bartels CF, Schelling DK Osteoporosis-Pseudoglioma Collaborative Group. Clinical and molecular findings in osteoporosis-pseudoglioma syndrome. Am J Hum Genet. 2005;77:741–53. - PMC - PubMed
    1. Alm A. Ocular circulation. In: Hart WM, editor. Adler’s Physiology of the Eye. 9. Saint Louis: Mosby; 1992. pp. 198–227.
    1. Armulik A, Abramsson A, Betsholtz C. Endothelial/pericyte interactions. Circ Res. 2005;97:512–523. - PubMed
    1. Barker TH, Framson P, Puolakkainen PA, Reed M, Funk SE, Sage EH. Matricellular homologs in the foreign body response: hevin suppresses inflammation, but hevin and SPARC together diminish angiogenesis. Am J Pathol. 2005;166:923–33. - PMC - PubMed

Publication types

MeSH terms

Associated data