. 2009 Dec;75(24):7725-33.
doi: 10.1128/AEM.00916-09. Epub 2009 Oct 16.

Autoaggregation response of Fusobacterium nucleatum

Affiliations

Autoaggregation response of Fusobacterium nucleatum

Justin Merritt et al. Appl Environ Microbiol. 2009 Dec.

Abstract

Fusobacterium nucleatum is a gram-negative oral bacterial species associated with periodontal disease progression. This species is perhaps best known for its ability to adhere to a vast array of other bacteria and eukaryotic cells. Numerous studies of F. nucleatum have examined various coaggregation partners and inhibitors, but it is largely unknown whether these interactions induce a particular genetic response. We tested coaggregation between F. nucleatum ATCC strain 25586 and various species of Streptococcus in the presence of a semidefined growth medium containing saliva. We found that this condition could support efficient coaggregation but, surprisingly, also stimulated a similar degree of autoaggregation. We further characterized the autoaggregation response, since few reports have examined this in F. nucleatum. After screening several common coaggregation inhibitors, we identified l-lysine as a competitive inhibitor of autoaggregation. We performed a microarray analysis of the planktonic versus autoaggregated cells and found nearly 100 genes that were affected after only about 60 min of aggregation. We tested a subset of these genes via real-time reverse transcription-PCR and confirmed the validity of the microarray results. Some of these genes were also found to be inducible in cell pellets created by centrifugation. Based upon these data, it appears that autoaggregation activates a genetic program that may be utilized for growth in a high cell density environment, such as the oral biofilm.


Figures

FIG. 1.
FIG. 1.
Effect of saliva concentration on autoaggregation. F. nucleatum cells were incubated in SDM containing a range of saliva concentrations and measured for OD every 10 min. The saliva concentrations are as follows: squares, 0%; triangles, 10%; asterisks, 25%; circles, 50%; and crosses, 75%. The results presented here are the average of three independent samples. This experiment was performed three times with similar results.
FIG. 2.
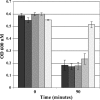
FIG. 2.
Effect of 50 mM coaggregation inhibitors on autoaggregation. F. nucleatum cells were incubated in SDM containing 25% saliva and several different coaggregation inhibitors. The samples from left to right are as follows: water, lactose, galactose, arginine, and lysine. The results presented here are the averages of three independent samples. This experiment was performed two times, with similar results each time.
FIG. 3.
FIG. 3.
Effect of lysine concentration on autoaggregation. F. nucleatum cells were incubated in SDM containing a range of lysine concentrations and measured for OD every 10 min. The lysine concentrations are as follows: squares, 0 mM; triangles, 6.25 mM; asterisks, 12.5 mM; circles, 25 mM; and crosses, 50 mM. The results presented here are the averages of three independent samples. This experiment was performed three times, with similar results each time.
FIG. 4.
FIG. 4.
Subtractive microarray approach to assay autoaggregation. As described in the text, the effect of autoaggregation was determined using two separate conditions: “SDM +/− saliva” and “SDM + saliva +/− lysine.” To determine whether a gene is either affected by aggregation or differences in medium composition, the responses from both conditions were compared. Only the gene responses that were similar between the two microarray experiments were considered to be due to autoaggregation, whereas gene responses that were specific to either of the two microarray datasets were attributed to factors unrelated to autoaggregation. Arrows underneath each microarray condition point to the total number of affected genes from each experiment. A comparison of the two datasets identified the shared gene responses, which were attributed to aggregation. The total number of genes within each geneset is listed.
FIG. 5.
FIG. 5.
Phase-contrast images of F. nucleatum cells used for microarray. Phase-contrast images of the same cultures used for RNA extraction and microarray were taken just prior to RNA extraction. The total magnification is ×1,000. The medium compositions are as follows: SDM (A), SDM plus 25% saliva (B), and SDM plus 25% saliva plus 50 mM lysine (C).
FIG. 6.
FIG. 6.
Real-time RT-PCR of selected genes from the microarray. Twelve genes identified from the microarray data were assayed by real-time RT-PCR. cDNAs for these experiments were synthesized using the same RNA samples as in the microarray. The data were normalized relative to the gene expression values of the planktonic samples, which were arbitrarily assigned a value of 1 and are not shown in the graph. White bars are results from the “+/− saliva” experiments, and the bars shaded in gray are the results from the “saliva +/− lysine” experiments. Shown here is one representative data set. This experiment was performed three times with similar results each time.
FIG. 7.
FIG. 7.
Real-time RT-PCR of genes induced by centrifugation. Of the 12 genes tested from the autoaggregation microarray, 6 were found to be inducible by centrifugation. Cell pellets were incubated for 1 h after centrifugation before the RNA was extracted to be used for the RT-PCR analysis. The data are normalized relative to the gene expression values of the dispersed samples, which were arbitrarily assigned a value of 1 and are not shown in the graph. White bars are representative of gene expression in cell pellets incubated in SDM, gray bars represent data from cell pellets incubated in SDM plus 25% saliva, and black bars represent data from cell pellets incubated in SDM plus 25% saliva plus 50 mM lysine. Shown here are the averages of three independent experiments.

References

    1. Ajdic, D., and V. T. Pham. 2007. Global transcriptional analysis of Streptococcus mutans sugar transporters using microarrays. J. Bacteriol. 189:5049-5059. - PMC - PubMed
    1. Andersen, R. N., N. Ganeshkumar, and P. E. Kolenbrander. 1998. Helicobacter pylori adheres selectively to Fusobacterium spp. Oral Microbiol. Immunol. 13:51-54. - PubMed
    1. Bakken, V., B. T. Hogh, and H. B. Jensen. 1989. Utilization of amino acids and peptides by Fusobacterium nucleatum. Scand. J. Dent. Res. 97:43-53. - PubMed
    1. Bartold, P. M., N. J. Gully, P. S. Zilm, and A. H. Rogers. 1991. Identification of components in Fusobacterium nucleatum chemostat-culture supernatants that are potent inhibitors of human gingival fibroblast proliferation. J. Periodontal Res. 26:314-322. - PubMed
    1. Boiangiu, C. D., E. Jayamani, D. Brugel, G. Herrmann, J. Kim, L. Forzi, R. Hedderich, I. Vgenopoulou, A. J. Pierik, J. Steuber, and W. Buckel. 2005. Sodium ion pumps and hydrogen production in glutamate fermenting anaerobic bacteria. J. Mol. Microbiol. Biotechnol. 10:105-119. - PubMed

Publication types

MeSH terms

Associated data