. 2010 Feb;9(2):225-41.
doi: 10.1074/mcp.M900223-MCP200. Epub 2009 Oct 16.

Performance metrics for liquid chromatography-tandem mass spectrometry systems in proteomics analyses

Affiliations

Performance metrics for liquid chromatography-tandem mass spectrometry systems in proteomics analyses

Paul A Rudnick et al. Mol Cell Proteomics. 2010 Feb.

Abstract

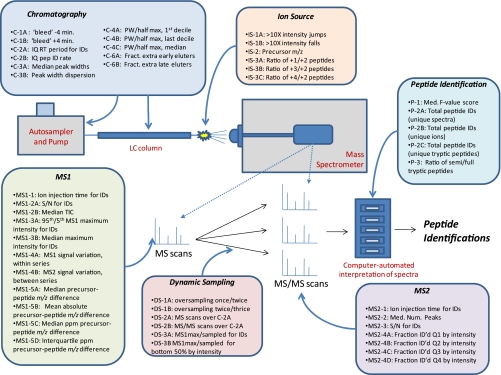
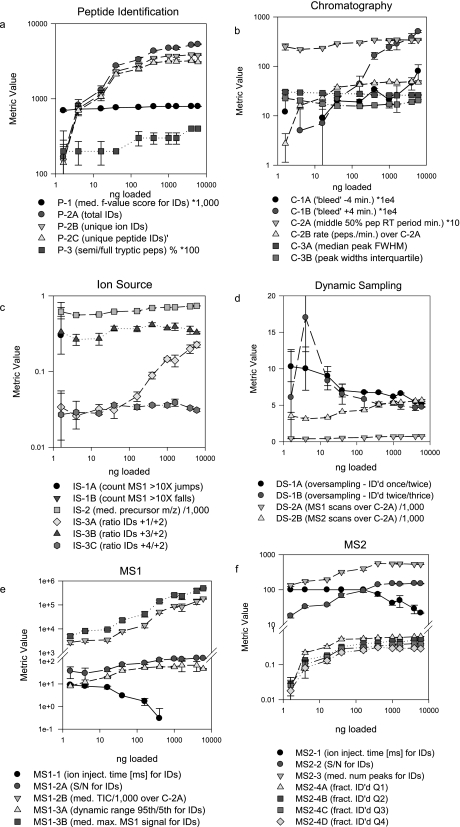
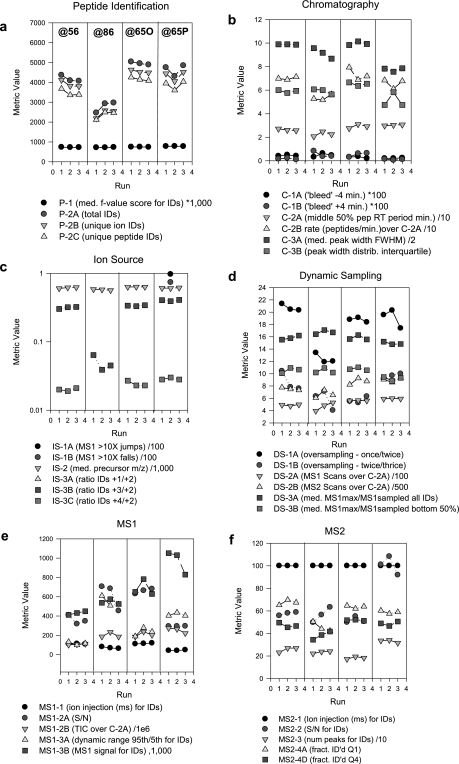
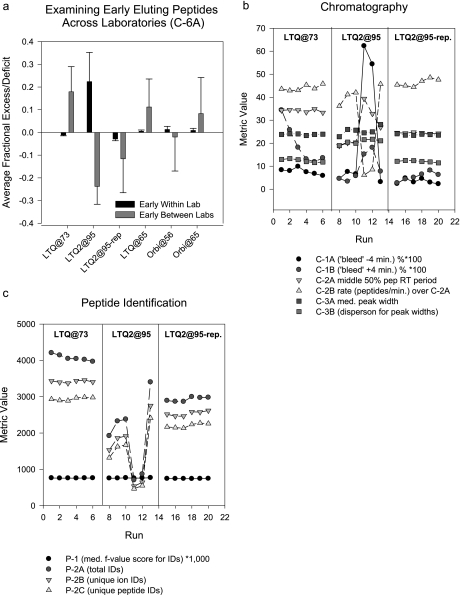
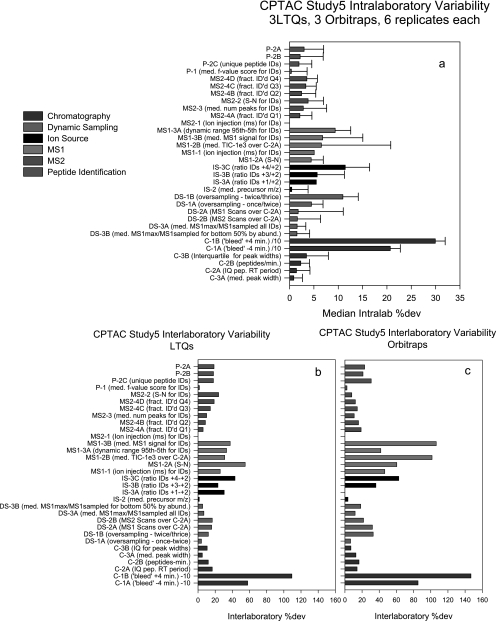
A major unmet need in LC-MS/MS-based proteomics analyses is a set of tools for quantitative assessment of system performance and evaluation of technical variability. Here we describe 46 system performance metrics for monitoring chromatographic performance, electrospray source stability, MS1 and MS2 signals, dynamic sampling of ions for MS/MS, and peptide identification. Applied to data sets from replicate LC-MS/MS analyses, these metrics displayed consistent, reasonable responses to controlled perturbations. The metrics typically displayed variations less than 10% and thus can reveal even subtle differences in performance of system components. Analyses of data from interlaboratory studies conducted under a common standard operating procedure identified outlier data and provided clues to specific causes. Moreover, interlaboratory variation reflected by the metrics indicates which system components vary the most between laboratories. Application of these metrics enables rational, quantitative quality assessment for proteomics and other LC-MS/MS analytical applications.


Figures

Fig. 1.
Fig. 1.
Schematic representation of performance metrics mapped to LC-MS/MS system elements. PW, peak width; IQ, interquartile; pep, peptide; ID, identification; Med., median; ID'd, identified; Fract., fraction; Num., number.
Fig. 2.
Fig. 2.
Illustration of chromatography metric C-2A applied to LC-MS/MS data from three Thermo LTQ systems in analyses of yeast proteome samples in CPTAC Study 5. Time intervals for elution of the middle quartiles of peptide identifications (C-2A) are indicated as are values for C-2B (peptide identification rate during this interval) and total peptide identifications during the analysis (P-2C). See text for discussion. peps, peptides.
Fig. 3.
Fig. 3.
Schematic representation of software pipeline to generate metrics. See text for discussion. OMSSA, open mass spectrometry search algorithm.
Fig. 4.
Fig. 4.
Stability and variation of metrics over a range of sample injection amounts. Serial dilutions of a tryptic digest of the CPTAC yeast reference proteome were analyzed in triplicate by LC-MS/MS on an LTQ instrument. Median values for each series were plotted according to the categories in Fig. 1. Error bars represent ±median error. Some values have been scaled as indicated in the panel legends. pep, peptide; IDs, identifications; med., median; ID'd, identified; fract., fraction; num, number; FWHM, full width at half-maximum; inject., injection.
Fig. 5.
Fig. 5.
Performance metrics for triplicate analyses of a tryptic digest of the CPTAC yeast reference proteome on four LTQ-Orbitraps at three different sites in CPTAC Study 6. Instruments labeled @56, @86, and @65O are LTQ-Orbitraps; the instrument labeled @65P is an LTQ-XL-Orbitrap. a–f display metrics according to category; values for each of the three runs are represented by a symbol. Low values for peptide identifications for instrument LTQ- Orbitrap@86 (a) coincide with low metric values for peptide ion charge states (metric IS-3B; c) and dynamic sampling (metric DS-1A; d) (see text for discussion). pep, peptide; IDs, identifications; med., median; ID'd, identified; fract., fraction; num, number; FWHM, full width at half-maximum; inject., injection.
Fig. 6.
Fig. 6.
Performance metrics for six replicate analyses of a tryptic digest of the yeast reference proteome on LTQ and Orbitrap instruments in CPTAC Study 5. Instruments labeled LTQ@73, LTQ@65, and LTQ@95 are LTQ instruments; the instrument labeled Orbi@56 is an LTQ-Orbitrap; the instrument labeled Orbi@65 is an LTQ-XL- Orbitrap. Marked variations in the relative number of early and late eluting peptides (a), chromatography metrics (b, middle section), and identifications (c, middle section) for instrument LTQ2@95 led to diagnosis and resolution of the problem (see text for discussion) as indicated by a second set of analyses on this instrument (LTQ2@95-rep). Instrument LTQ@73 is included in both panels as representative of the performance of the other instruments. The Orbitraps were included in the analysis and in a as a source of diversity from different laboratories and to demonstrate the usefulness of the chromatographic metrics across instrument platforms. Error bars represent median error. med., median; IDs, identifications.
Fig. 7.
Fig. 7.
Summary of intralaboratory and interlaboratory variation for metrics for three LTQ and three LTQ-Orbitrap instruments in six replicate analyses of a tryptic digest of CPTAC yeast reference proteome in CPTAC Study 5. The instruments labeled LTQ are all LTQ model instruments; the instruments labeled Orbis include two LTQ-Orbitraps and one LTQ-XL-Orbitrap. Metrics are grouped by system category and ranked by code for comparison between panels. Intralaboratory variation in %dev for each metric and variation in %dev are shown in a. b and c show interlaboratory variation in metrics for LTQ and Orbitrap instruments, respectively. IQ, interquartile; pep, peptide; IDs, identifications; med., median; ID'd, identified; fract., fraction; num, number.

References

    1. Yates J. R., 3rd ( 2004) Mass spectral analysis in proteomics. Annu. Rev. Biophys. Biomol. Struct 33, 297– 316 - PubMed
    1. Aebersold R., Mann M. ( 2003) Mass spectrometry-based proteomics. Nature 422, 198– 207 - PubMed
    1. Liu H., Lin D., Yates J. R., 3rd ( 2002) Multidimensional separations for protein/peptide analysis in the post-genomic era. BioTechniques 32, 898, 900,, 902 - PubMed
    1. Eriksson J., Fenyö D. ( 2007) Improving the success rate of proteome analysis by modeling protein-abundance distributions and experimental designs. Nat. Biotechnol 25, 651– 655 - PubMed
    1. Whiteaker J. R., Zhang H., Zhao L., Wang P., Kelly-Spratt K. S., Ivey R. G., Piening B. D., Feng L. C., Kasarda E., Gurley K. E., Eng J. K., Chodosh L. A., Kemp C. J., McIntosh M. W., Paulovich A. G. ( 2007) Integrated pipeline for mass spectrometry-based discovery and confirmation of biomarkers demonstrated in a mouse model of breast cancer. J. Proteome Res 6, 3962– 3975 - PubMed

Publication types

LinkOut - more resources