. 2009 Nov;6(11):817-23.
doi: 10.1038/nmeth.1390. Epub 2009 Oct 18.

Visual proteomics of the human pathogen Leptospira interrogans

Affiliations

Visual proteomics of the human pathogen Leptospira interrogans

Martin Beck et al. Nat Methods. 2009 Nov.

Abstract

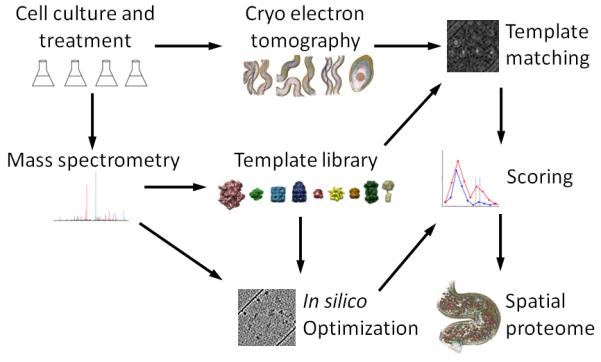
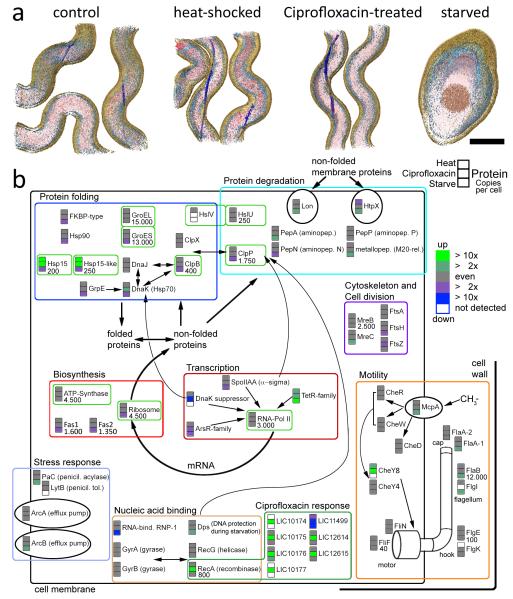
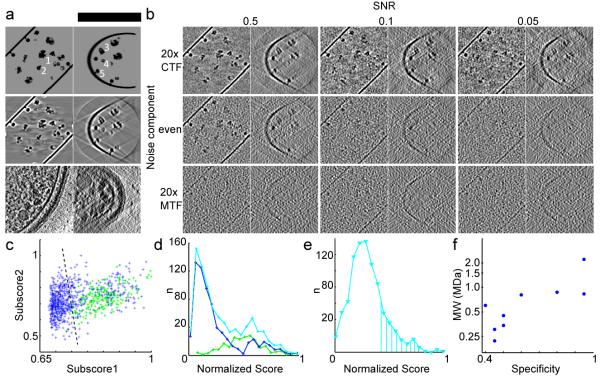
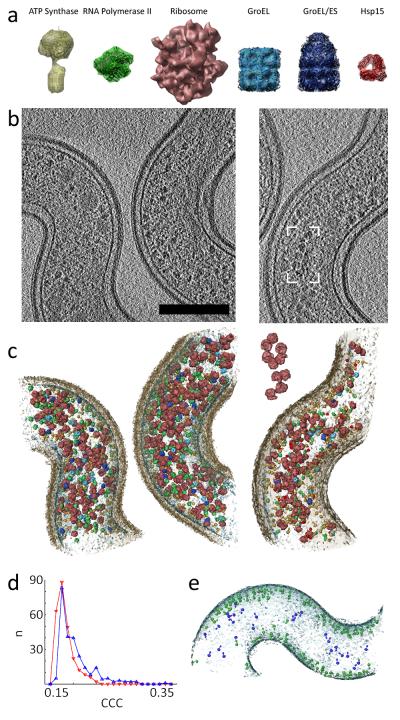
Systems biology conceptualizes biological systems as dynamic networks of interacting elements, whereby functionally important properties are thought to emerge from the structure of such networks. Owing to the ubiquitous role of complexes of interacting proteins in biological systems, their subunit composition and temporal and spatial arrangement within the cell are of particular interest. 'Visual proteomics' attempts to localize individual macromolecular complexes inside of intact cells by template matching reference structures into cryo-electron tomograms. Here we combined quantitative mass spectrometry and cryo-electron tomography to detect, count and localize specific protein complexes in the cytoplasm of the human pathogen Leptospira interrogans. We describe a scoring function for visual proteomics and assess its performance and accuracy under realistic conditions. We discuss current and general limitations of the approach, as well as expected improvements in the future.


Figures

Figure 1
Figure 1
An integrated workflow for visual proteomics. Differently stimulated cells were subjected to shotgun MS and cryoET analysis. A template library was built that included the protein complexes identified in the proteome for which structures of satisfying homology were available. Targeted, quantitative mass spectrometry was employed to determine cellular concentration of the selected targets and to detect inducible changes in their abundance levels in different cellular states. Phantom cells were generated based on the quantitative Leptospira proteome in order to estimate the accuracy of template detection and to train a novel scoring function. The templates were cross correlated with the electron optical density in the tomograms by template matching as described earlier and assigned into the spatial context of the cell using the statistically evaluated, optimized scoring function.
Figure 2
Figure 2
Stress response of L. interrogans cells in the context of the protein complexes selected as templates for template matching (bright green boxes). Cells of exponentially growing cultures were incubated for 1 h at 42 °C, for 24 h in the presence of 5 μg μl−1 Ciprofloxacin or for 7 d in the absence of nutrients, respectively, and compared against non-treated control cultures. 3D surface rendered volumes are shown in (a) with the cytoplasm colored in red, membranes in bright blue, periplasmic flagella in dark blue and the cell wall in brown (scale bar: 200 nm) (b) Up and down regulation for each protein is shown in green and blue color, respectively, for the heat shock (fever), antibiotics (Ciprofloxacin treatment) and starvation condition versus the control condition. Proteins are grouped based on their function. The relative abundance of many proteins is reduced under starvation and heat shock proteins are strongly up-regulated under both stress conditions (heat shock and antibiotic treatment). While the abundance of the Ciprofloxacin target DNA-gyrase stayed level upon treatment, recombinase A and a cluster of (so far) hypothetical proteins showed a very strong response (dark green box). Copy numbers per cell, as determined by SRM, are given for the control condition (if applicable).
Figure 3
Figure 3
Generation of in silico test data and development of a scoring function for template matching in cryo electron tomograms. (a) An unprocessed phantom cell (top, scale bar: 150 nm) and tomographic reconstruction without noise (middle) are shown in comparison to a real data set (bottom). The positions of a Ribosome (1), RNA-Polymerase (2), GroEL (3), Hsp (4) and ATP-Synthase are indicated. (b) Reconstructions with an SNR of 0.5, 0.1 and 0.05 are shown with predominant quantum (top), even (middle) and predominant detector noise component (bottom). The noise models in the middle left (conservative) and top right (optimistic) are discussed in text. All panels in (a) and (b) are slices through reconstructions of 5 nm in thickness displayed along the Z-axis (left) and X-axis (right). (c-e) Performance of RNA-Polymerase II detection. (c) Linear discrimination of the subscores 1 and 2 in the in silico test data sets; true and false positives in green and blue, optimal discrimination threshold as dashed line. (d) Score distribution in the in silico test data sets; true and false positives in green and blue, cumulative curve in cyan. (e) Score distribution from real data. The marked area under the curve corresponds to the absolute abundance expectation value for the given cellular volume as determined by SRM. The curve shape is very similar to the theoretical distribution shown in (d). (f) Logarithm of the molecular weight plotted against the specificity achieved in silico at 50% sensitivity (conservative noise model).
Figure 4
Figure 4
Template matching in subvolumes of L. interrogans cells. (a) Template library of protein complexes which are shown scaled to each other and superimposed with amino acid chain traces (in black, if applicable). The surface rendering has been done at the relevant resolution of the references applied to template matching. (b-c) The localization of the targeted protein complexes by template matching is shown for representative subvolume of the non-stimulated (left) and antibiotics-treated condition (right). Scale bar: 200 nm. (b) Slices through the reconstructed volumes of 7 nm in thickness without post-processing, (c) surface rendered model of the assigned templates in context with the cell wall (transparent brown) and membrane (transparent blue). The Box and inset show a group of ribosomes resembling the pseudo-planar relative orientation of poly-ribosomes reported recently for bacterial lysates . (d) Distribution of the top 250 cross correlation coefficients (CCCs) extracted a tomograms with the ribosome (blue) as template and mirrored ribosome as decoy template (red). The cross-correlation intensity is lower in case of the decoy template and the curve shape changes. (e) Matches of ATP Synthase in a L. interrogans cell in context with the cell membrane. Singles particles with a plausible positioning and orientation (membrane embedded and pointing into the cytoplasm) are colored in green, non-plausible false positives in blue.

Comment in

References

    1. Aebersold R, Mann M. Mass spectrometry-based proteomics. Nature. 2003;422:198–207. - PubMed
    1. Lucic V, Forster F, Baumeister W. Structural studies by electron tomography: from cells to molecules. Annual review of biochemistry. 2005;74:833–865. - PubMed
    1. Best C, Nickell S, Baumeister W. Localization of protein complexes by pattern recognition. Methods in cell biology. 2007;79:615–638. - PubMed
    1. Nickell S, Kofler C, Leis AP, Baumeister W. A visual approach to proteomics. Nature Reviews Molecular Cell Biology. 2006;7:225–230. - PubMed
    1. Frangakis AS, et al. Identification of macromolecular complexes in cryoelectron tomograms of phantom cells. Proc. Natl. Acad. Sci.USA. 2002;99:14153–14158. - PMC - PubMed

Publication types

MeSH terms