. 2009 Nov;11(11):1315-24.
doi: 10.1038/ncb1984. Epub 2009 Oct 18.

Topoisomerase I suppresses genomic instability by preventing interference between replication and transcription

Affiliations

Topoisomerase I suppresses genomic instability by preventing interference between replication and transcription

Sandie Tuduri et al. Nat Cell Biol. 2009 Nov.

Erratum in

  • Nat Cell Biol. 2010 Nov;12(11):1122

Abstract

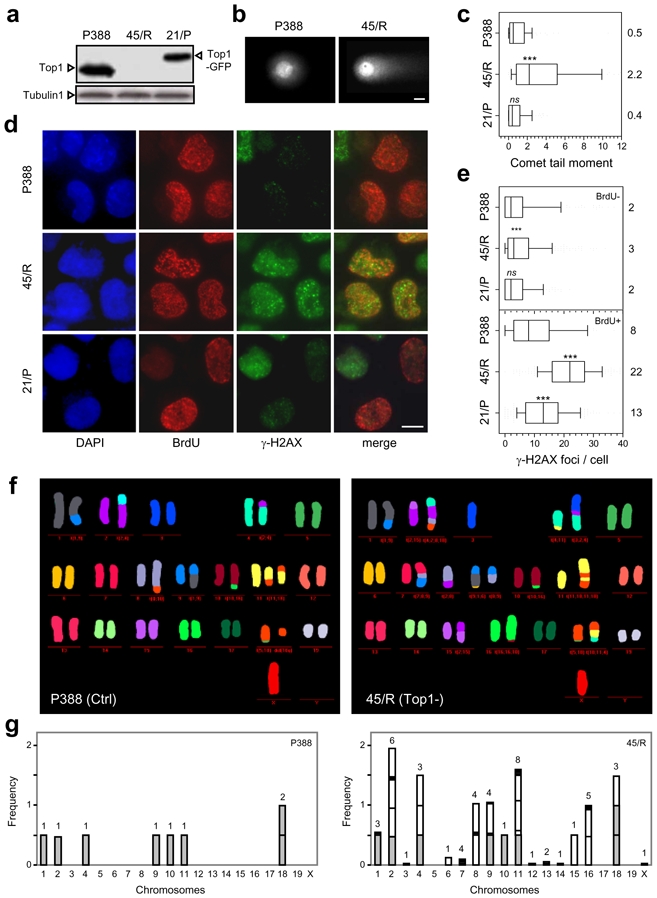
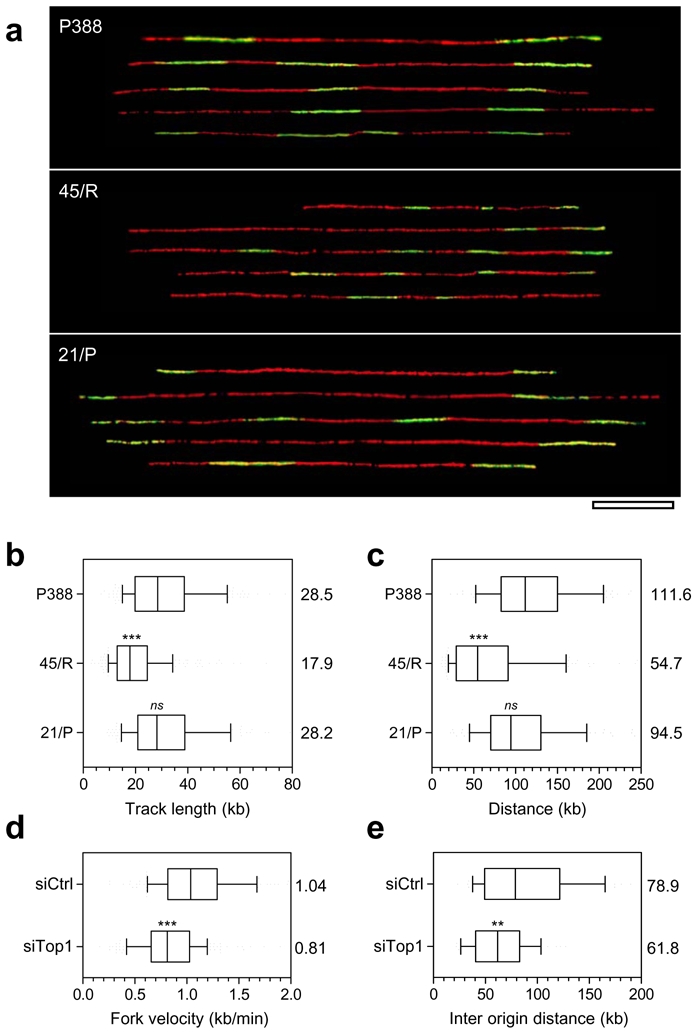
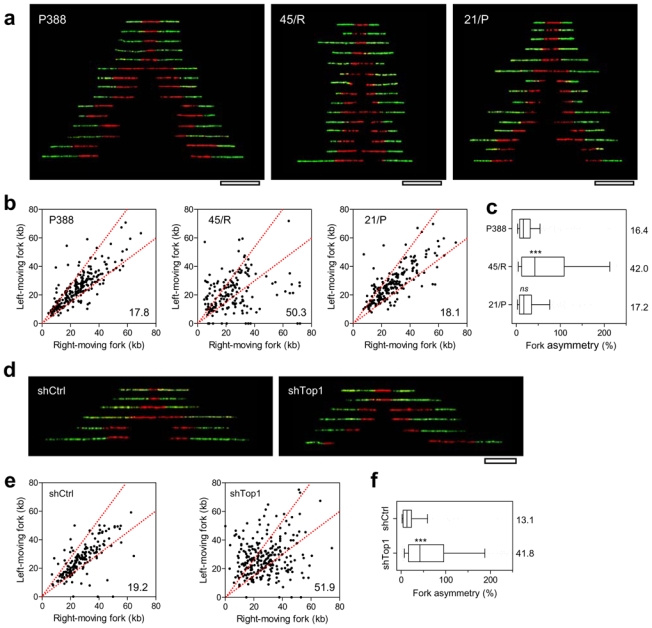
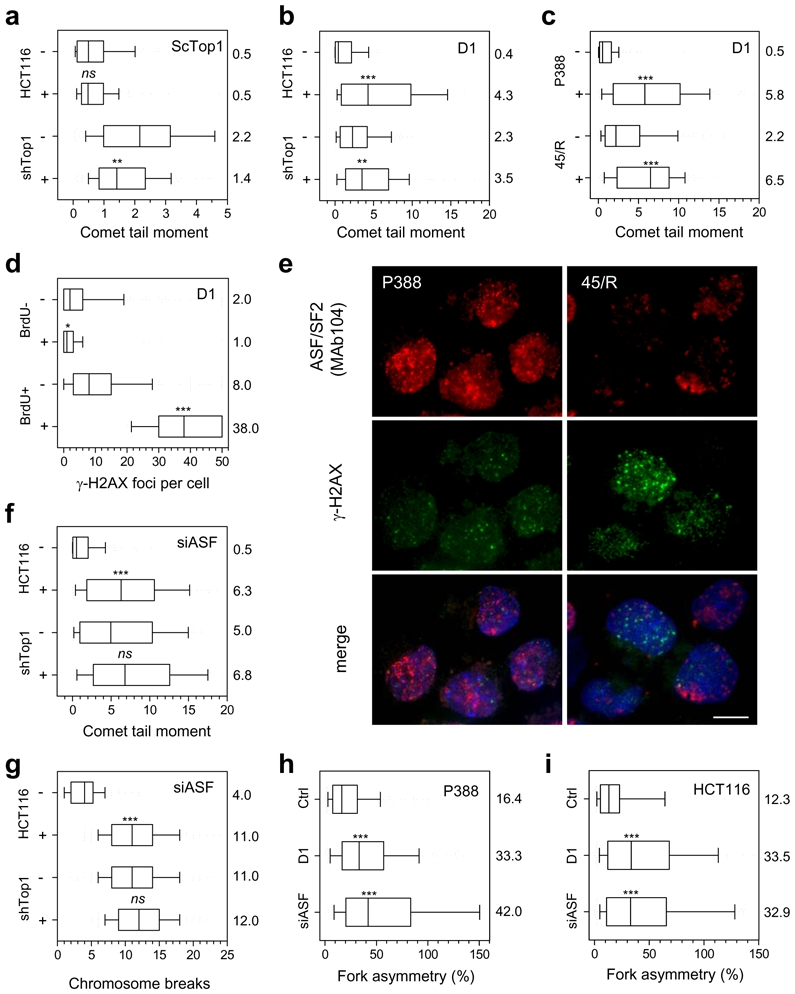
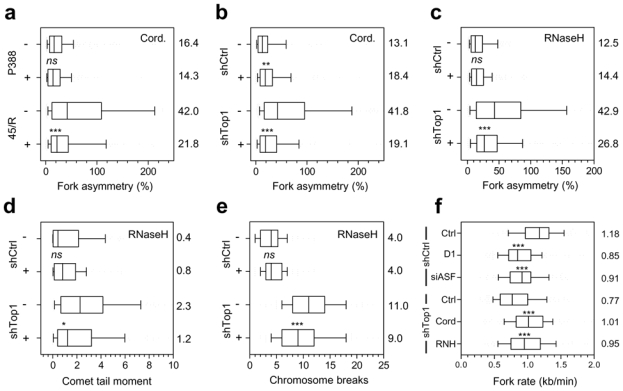
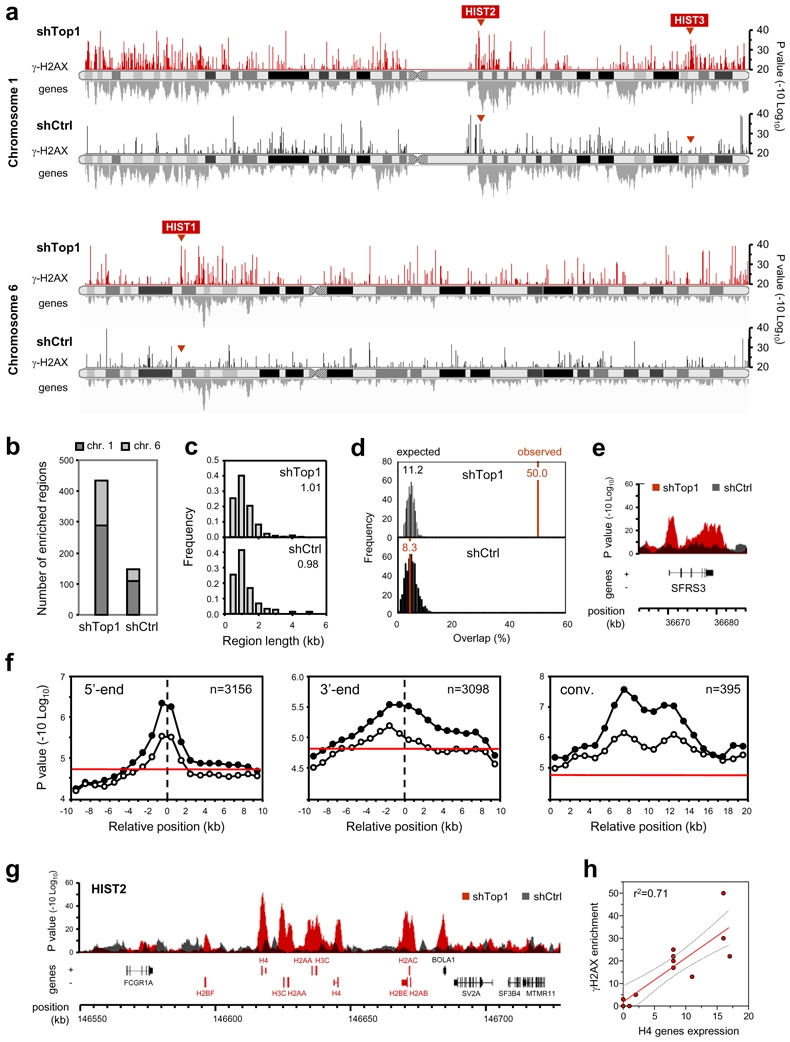
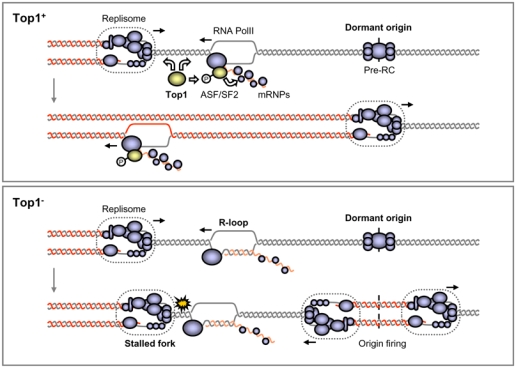
Topoisomerase I (Top1) is a key enzyme in functioning at the interface between DNA replication, transcription and mRNA maturation. Here, we show that Top1 suppresses genomic instability in mammalian cells by preventing a conflict between transcription and DNA replication. Using DNA combing and ChIP (chromatin immunoprecipitation)-on-chip, we found that Top1-deficient cells accumulate stalled replication forks and chromosome breaks in S phase, and that breaks occur preferentially at gene-rich regions of the genome. Notably, these phenotypes were suppressed by preventing the formation of RNA-DNA hybrids (R-loops) during transcription. Moreover, these defects could be mimicked by depletion of the splicing factor ASF/SF2 (alternative splicing factor/splicing factor 2), which interacts functionally with Top1. Taken together, these data indicate that Top1 prevents replication fork collapse by suppressing the formation of R-loops in an ASF/SF2-dependent manner. We propose that interference between replication and transcription represents a major source of spontaneous replication stress, which could drive genomic instability during the early stages of tumorigenesis.


Figures

Figure 1
Figure 1
Top1-deficient murine cells form DNA breaks in S phase and accumulate chromosomal aberrations. (a) Top1 levels in control murine leukaemia cells (P388), Top1-cells (45/R) and Top1-cells complemented with Top1-GFP (21/P). (b, c) Quantification of DNA breaks by comet assay. Representative nuclei are shown. Bar: 5 μm. Tail moment was calculated as described in the Methods section. Boxes indicate the 25–75 percentile and whiskers the 10–90 percentile. Vertical lines mark the medians (in kb). Data not included between the whiskers are plotted as outliers (dots). Differences between distributions were assessed with the Mann-Whitney rank sum test. ***: P<0.0001, ns: P=0.12. (d) P388, 45/R and 21/P cells were pulse-labelled for 10 min with BrdU and analysed by indirect immunofluorescence with antibodies against BrdU (red) and γ-H2AX (green). Bar: 5 μm. (e): Frequency of γ-H2AX foci in 300 BrdU negative (BrdU−) and BrdU positive (BrdU+) cells. See Table S1 for numerical values. (f) Analysis of structural aberrations in P388 and 45/R cells by M-FISH. Representative karyotypes are shown. (g) Cumulative frequency of individual structural aberrations detected in 45/R cells. Gray boxes correspond to events also detected in P388 cells. (h) FISH analysis of the expression of common fragile sites in control (shCtrl) and Top1-deficient (shTop1) HCT116 cells. Representative image showing chromosome breaks at FRA3B (red). (i) Frequency of chromosome breaks at FRA3B, FRA16D and FRAXB in shCtrl and shTop1 cells.
Figure 2
Figure 2
Replication fork progression is impaired in the absence of Top1. (a) Single-molecule analysis of DNA replication. P388 (control), 45/R (Top1−) and 21/P (Top1-GFP) cells were pulse-labelled for 15 min with BrdU and fibres were stretched by DNA combing. Red: DNA, Green: BrdU. Bar: 50 kb. (b) Distribution of BrdU tracks length in murine cells. Box: 25–75 percentile range. Whiskers: 10–90 percentile range. Medians are indicated in kb. (c) Distribution of centre-to-centre distances between BrdU tracks in murine cells. (d) Replication fork rate in HCT116 cells transfected with siCtrl and siTop1 siRNAs. (e) Inter-origin distance in shTop1 and shCtrl HCT116 cells.
Figure 3
Figure 3
Analysis of sister replication forks progression in Top1-depleted cells. (a) Asynchronous cultures of P388 (control), 45/R (Top1−) and 21/P (Top1-GFP) mouse leukaemia cells were pulsed-labelled with IdU (15 min) and CldU (15 min) and processed for DNA combing. Representative pairs of sister replication forks were assembled from different fields of view and were arbitrarily centred on the position of origin. Red: IdU, Green: CldU. Bar: 50 kb. (b) Scatter plot of the distance covered by right-moving and left-moving sister forks during the CldU pulse in murine cells. The central area delimited with red lines contains sister forks with less than a 25% length difference. The percentage of outliers (asymmetrical signals) is indicated. (c) Relative fork asymmetry in murine cells. Fork asymmetry is expressed as the ratio of the distances covered by sister replication forks during the CldU pulse. Median values are indicated. (d) HCT116 shCtrl and shTop1 cells were pulse-labelled for 15 min with IdU and 15 min with CldU and processed as described for murine cells. Representative pairs of sister replication forks are shown. Bar: 20 kb. (e, f) Scatter plot and box plot of fork asymmetry in shCtrl and shTop1 cells.
Figure 4
Figure 4
Inhibition of ASF/SF2 function induces fork asymmetry and chromosome breaks. (a) Analysis of DNA damage (comet assay) in shCtrl and shTop1 HCT116 cells, transfected with S. cerevisiae Top1 (+) or with an empty vector (−). (b) Immunodetection of SR proteins in murine P388 (Control) and 45/R (Top1−) cells using the phospho-specific pan-SR antibody Mab104 (Red). Green: γ-H2AX. Blue: DAPI. (c) Analysis of DNA damage in shCtrl and shTop1 HCT116 cells treated for 24 hrs with a siRNA against ASF/SF2. (d) Representative image of a metaphase plate from shTop1 cells. Arrows point to broken chromosomes. (e) Number of chromosome breaks on metaphase spreads in shCtrl and shTop1 cells transfected (+) or not (−) with siASF. Median values are indicated. (f) Analysis of DNA damage in murine cells treated (+) or not (−) with the Top1 kinase inhibitor Diospyrin (D1). (g) Frequency of γ-H2AX foci in BrdU-positive (BrdU+) and BrdU negative (BrdU−) P388 cells treated (+) or not (−) with Diospyrin (D1). (h, i) Murine P388 and human HCT116 cells were treated with the Top1 kinase inhibitor Diospyrin (D1) or were transfected with a siRNA against ASF/SF2 (siASF). Sister fork coordination was analysed by DNA combing as described in Fig. 3.
Figure 5
Figure 5
RNaseH1 suppresses fork asymmetry and DNA damage in Top1− cells. (a) Murine cells were treated with Cordycepin and sister fork progression was analysed by DNA combing in treated (+) or untreated (−) cells as described above. Median values are indicated. (b) DNA combing analysis of fork asymmetry in HCT116 control and shTop1 cells treated with Cordycepin. (c–e) shCtrl and shTop1 HCT116 cells were transfected (+) or not (−) with a vector expressing RNaseH1. Percentage of sister fork asymmetry (d), DNA damage (e) and chromosome breaks (e) were monitored. (f) Box plots of fork rate in murine P388 and 45/R cells and in human shCtrl and shTop1 HCT116 cells. Fork rates in HCT116 control and shTop1 was determined by DNA combing after double labelling with IdU and CldU, as described in Fig. 2d. Cells were treated with Diospyrin (D1), siASF1, Cordycepin (Cord.) and RNaseH1 as described the Methods section.
Figure 6
Figure 6
γ-H2AX is enriched at active genes in Top1- HCT116 cells. (a) Chromatin from shCtrl and shTop1 HCT116 cells was immunoprecipitated with a phospho-specific antibody that recognises γ-H2AX and DNA was hybridised on high-density tiling arrays (35-bp resolution) covering human chromosomes 1 and 6. Maps corresponding to two combined biological replicates are shown. γ-H2AX-enriched loci (p<0.01) are shown in red for shTop1 cells and in grey for shCtrl cells. Gene density is shown below chromosome maps. The position of the three major histone genes clusters is indicated (HIST1, HIST2, HIST3). (b) Number of γ-H2AX-enriched regions (p<0.01) on chromosome 1 and 6 in shTop1 and shCtrl cells. (c) Length distribution of γ-H2AX-enriched regions. (d) Percentage of experimentally derived bases within 2 kb of the 5′- or the 3′-ends of an annotated gene (red). The distribution of expected overlap if γ-H2AX loci were randomly distributed is indicated in black. (e) Example of γ-H2AX-enrichment (p<0.01) at the SFRS3 gene on chromosome 6. Red: shTop1 cells. Gray: shCtrl cells. (f) Average γ-H2AX enrichment for shCtrl (open circles) and shTop1 (filled circles) cells mapped on the complete set of protein-coding genes on human chromosomes 1 and 6 with a sliding window of 1 kb. Maps are centred on the 5′- or the 3′-boundary of genes and on intergenic spacers between converging genes (conv.) distant from less than 20 kb. (g) High-resolution map of the HIST2 locus. Histone genes on (+) and (−) strands are shown in red and non-histone genes are labelled in black. (h) Positive correlation between the normalized level of histone H4 genes expression and γ-H2AX enrichment (−10 Log10) in shTop1 cells. Dotted lines indicate 95% confidence intervals.
Figure 7
Figure 7
Model for the role of Top1 in the coordination of DNA replication and gene expression. Besides its DNA relaxation activity, Top1 promotes the ASF/SF2-dependent assembly of mRNPs to prevent the formation of R-loops, which are toxic to replication forks. In Top1-proficient cells (Top1+), replication forks progress at a normal rate and dormant origins are passively replicated by ongoing forks. In absence of Top1 (Top1−), defective RNA processing leads to the formation of R-loops, which block fork progression, generate DNA breaks and induce H2AX phosphorylation. In most cases, stalled forks are rescued by replisomes progressing from dormant origins, which fire more frequently in Top1− cells. Regions of the genome that contain fewer backup origins or that replicate very late in S phase could be more prone to irreversible fork stalling and to chromosomal rearrangements.

Similar articles

Cited by

References

    1. Aladjem MI. Replication in context: dynamic regulation of DNA replication patterns in metazoans. Nat Rev Genet. 2007;8:588–600. - PubMed
    1. Ivessa AS, et al. The Saccharomyces cerevisiae helicase Rrm3p facilitates replication past nonhistone protein-DNA complexes. Mol Cell. 2003;12:1525–1536. - PubMed
    1. Tourriere H, Pasero P. Maintenance of fork integrity at damaged DNA and natural pause sites. DNA Repair. 2007;6:900–913. - PubMed
    1. Aguilera A, Gomez-Gonzalez B. Genome instability: a mechanistic view of its causes and consequences. Nat Rev Genet. 2008;9:204–217. - PubMed
    1. Bartkova J, et al. Oncogene-induced senescence is part of the tumorigenesis barrier imposed by DNA damage checkpoints. Nature. 2006;444:633–637. - PubMed

Publication types

Substances